

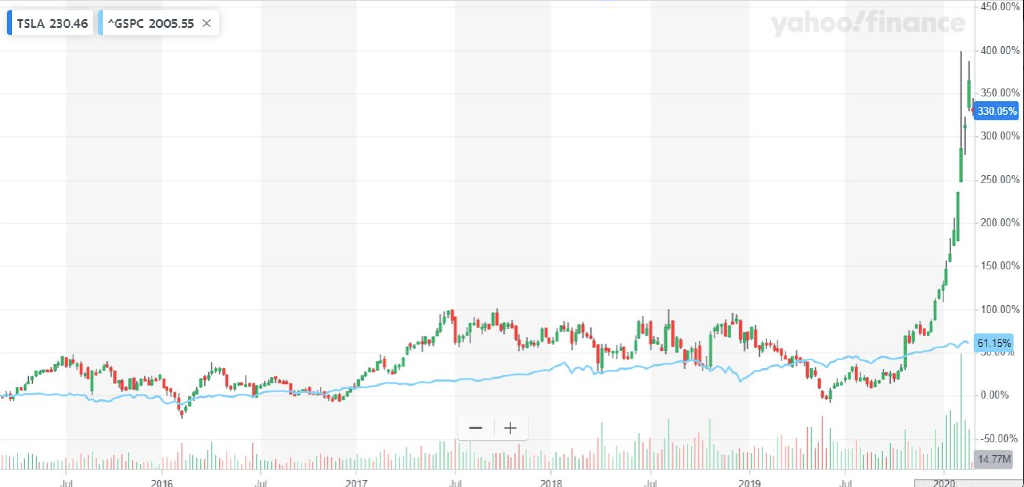
Question: Look at the picture comparing the 5 year returns for Tesla (TSLA) and S&P 500 (^GSPC). It's obvious that the return volatility (i.e. standard deviation
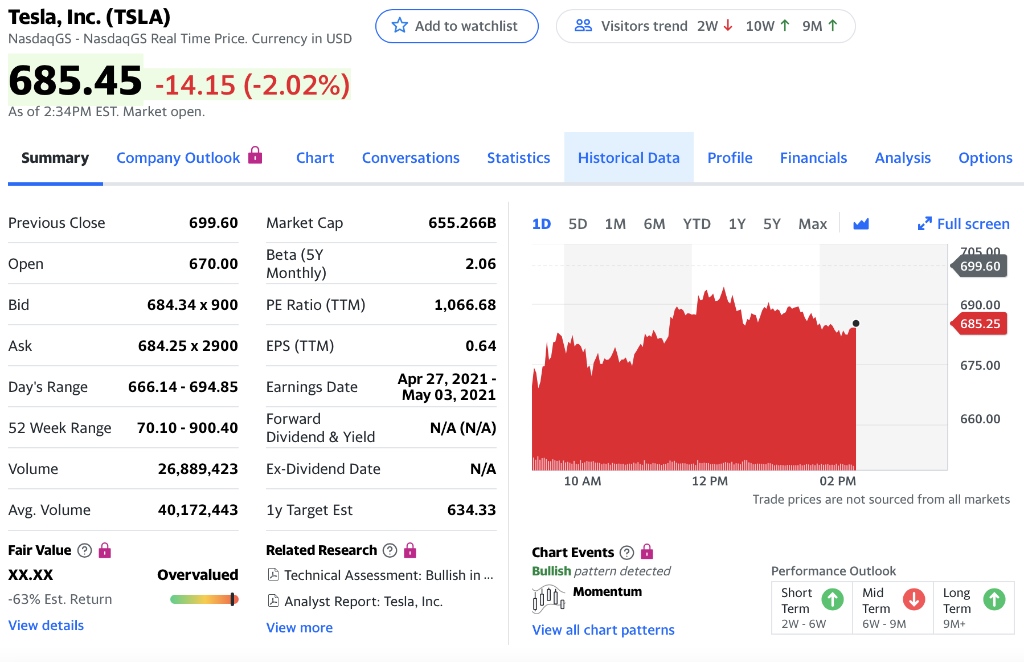
- Look at the picture comparing the 5 year returns for Tesla (TSLA) and S&P 500 (^GSPC). It's obvious that the return volatility (i.e. standard deviation of returns) of Tesla stock is at least 5-10 times greater than that of S&P 500 (the blue line). Yet, if you look up Tesla's 5 year beta (on the summary page of Yahoo Finance (Links to an external site.)), it is only around 2 suggesting that TSLA is only twice as volatile as the market (represented by S&P500 index).
- How do you explain this discrepancy between what standard deviation tells you (that TSLA is 5 to 10 times more volatile than the market) and what beta tells you (that the stock is about twice as risky as the overall market (SP500))?
450 00% TSLA 230.46 AGSPC 2005.55 X yahoo/finance 400.00% 350 00% 330.05% 300.00% 250.00% 200 00% 150 00% 100.00% 1,47 61.15% JUU 20 -0.00% -50.00% 14.77M Jul 2016 2017 2018 2019 Jul 2020 Tesla, Inc. (TSLA) NasdaqGs - Nasdaq GS Real Time Price. Currency in USD Add to watchlist 9 Visitors trend 2w10W 9M 1 685.45 -14.15 (-2.02%) As of 2:34PM EST. Market open, Summary Company Outlook @ Chart Conversations Statistics Historical Data Profile Financials Analysis Options Previous Close 699.60 Market Cap 655.266B 1D 5D 1M 6M YTD 1 Y 5Y Max Full screen Open 670.00 Beta (5Y Monthly) 2.06 705.00 699.60 Bid 684.34 x 900 PE Ratio (TTM) 1,066.68 690.00 685.25 Ask 684.25 x 2900 EPS (TTM) 0.64 675.00 Day's Range 666.14 - 694.85 Earnings Date Apr 27, 2021 - May 03, 2021 660.00 52 Week Range 70.10 - 900.40 Forward Dividend & Yield N/A (N/A) Volume 26,889,423 Ex-Dividend Date N/A 10 AM 12 PM 02 PM Trade prices are not sourced from all markets Avg. Volume 40,172,443 1y Target Est 634.33 Fair Value A Related Research Technical Assessment: Bullish in ... XX.XX Overvalued Chart Events A Bullish pattern detected Momentum -63% Est. Return Analyst Report: Tesla, Inc. Performance Outlook Short Mid Term Term 2W - 6W 6W - 9M Long Term 9M+ View details View more View all chart patterns 450 00% TSLA 230.46 AGSPC 2005.55 X yahoo/finance 400.00% 350 00% 330.05% 300.00% 250.00% 200 00% 150 00% 100.00% 1,47 61.15% JUU 20 -0.00% -50.00% 14.77M Jul 2016 2017 2018 2019 Jul 2020 Tesla, Inc. (TSLA) NasdaqGs - Nasdaq GS Real Time Price. Currency in USD Add to watchlist 9 Visitors trend 2w10W 9M 1 685.45 -14.15 (-2.02%) As of 2:34PM EST. Market open, Summary Company Outlook @ Chart Conversations Statistics Historical Data Profile Financials Analysis Options Previous Close 699.60 Market Cap 655.266B 1D 5D 1M 6M YTD 1 Y 5Y Max Full screen Open 670.00 Beta (5Y Monthly) 2.06 705.00 699.60 Bid 684.34 x 900 PE Ratio (TTM) 1,066.68 690.00 685.25 Ask 684.25 x 2900 EPS (TTM) 0.64 675.00 Day's Range 666.14 - 694.85 Earnings Date Apr 27, 2021 - May 03, 2021 660.00 52 Week Range 70.10 - 900.40 Forward Dividend & Yield N/A (N/A) Volume 26,889,423 Ex-Dividend Date N/A 10 AM 12 PM 02 PM Trade prices are not sourced from all markets Avg. Volume 40,172,443 1y Target Est 634.33 Fair Value A Related Research Technical Assessment: Bullish in ... XX.XX Overvalued Chart Events A Bullish pattern detected Momentum -63% Est. Return Analyst Report: Tesla, Inc. Performance Outlook Short Mid Term Term 2W - 6W 6W - 9M Long Term 9M+ View details View more View all chart patterns
Step by Step Solution
There are 3 Steps involved in it

Get step-by-step solutions from verified subject matter experts