

Question: Look carefully at each graph. Then, answer the questions specifically and in detail. Keep in mind that, to obtain the full value that corresponds to

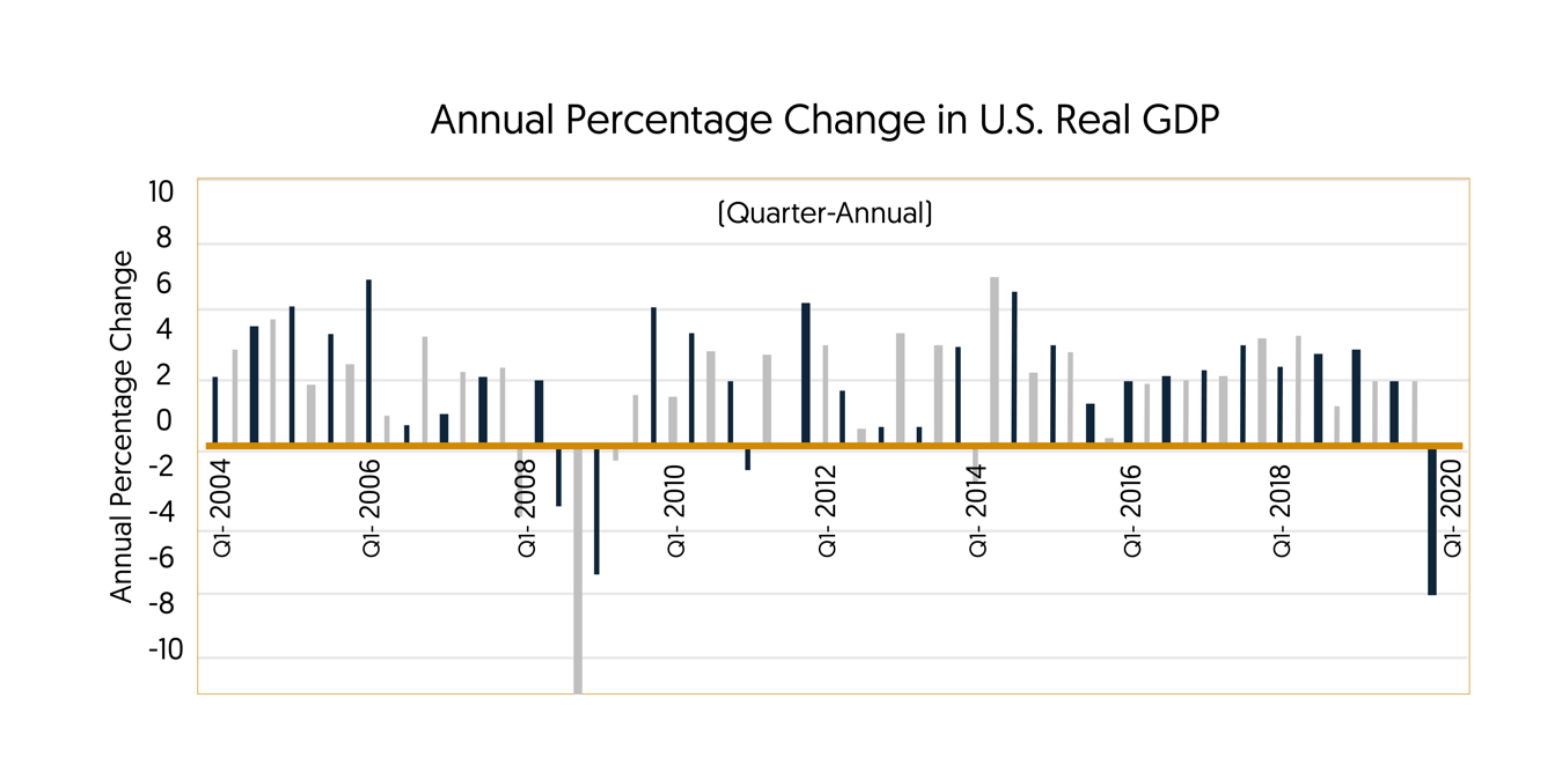
Look carefully at each graph. Then, answer the questions specifically and in detail. Keep in mind that, to obtain the full value that corresponds to each question, you must answer what is requested with the correct information, demonstrating that you understand and can properly apply the concepts studied. Try to address all elements of each question and always express the answers in your own words. The graph in Figure I presents the annual GDP growth rate of the United States economy since the first quarter of 2004, while the graphs in Figure II represent three different scenarios of the relationship. . between aggregate demand and supply that reflect different situations of economic growth. In accordance with what was discussed in the module, answer the following questions in detail.
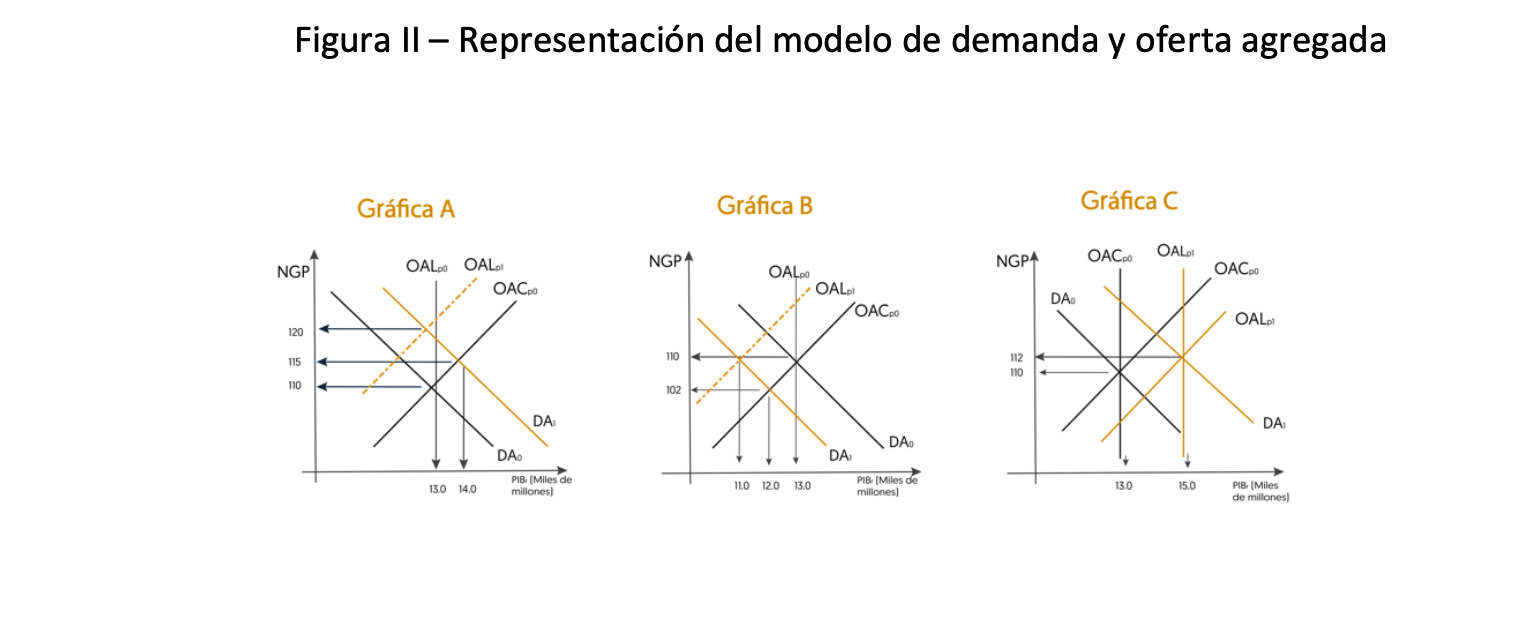
- Using the shifts in the aggregate demand curve in each of the three graphs in Figure II, explain the function of aggregate consumption and investment.
- Explain in detail what is happening in Graph A in Figure II and, after examining the data in the graph in Figure I, identify in what time period this situation is occurring.
- Explain in detail what is happening in Graph B in Figure II and, after examining the data in the graph in Figure I, identify in what period of time said situation is occurring.
- Explain in detail what is happening in Graph C in Figure II and, after examining the data in the graph in Figure I, identify in what time period this situation is occurring.

\fFigura II - Representacion del modelo de demanda y oferta agregada Grafica A Grafica B Grafica C NGP4 NGP OALDO OALot NGPA OAC DO OAC PO 120 115 110 112 110 102 DA DAo DA PIB [Miles de 13.0 14.0 millones) 110 12.0 13.0 PIB [Miles de 130 15.0 millones) PIB (Miles de millones)
Step by Step Solution
There are 3 Steps involved in it

Get step-by-step solutions from verified subject matter experts