

Question: Looking at my financial analysis, why are the values I get from hand calculating NPV different from what I get when I use the Excel
Looking at my financial analysis, why are the values I get from hand calculating NPV different from what I get when I use the Excel function? Is there a change I can make to the formulas that would get me the same value for both?
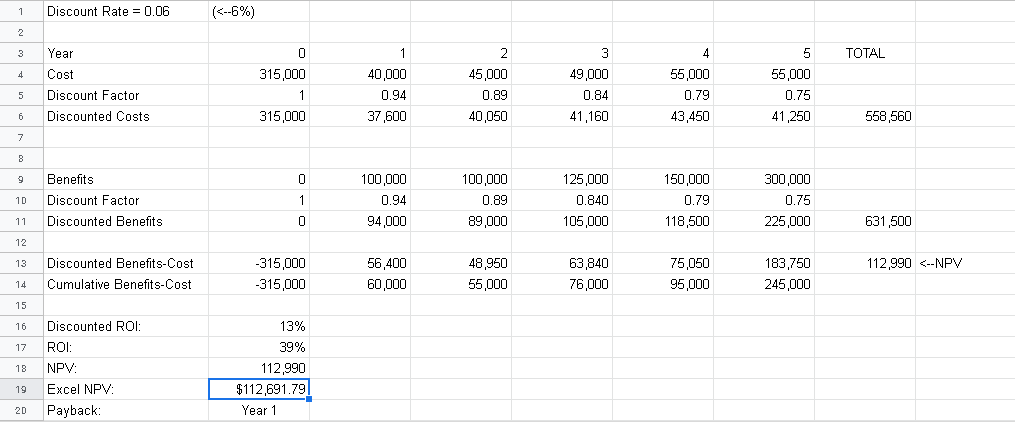
1 Discount Rate 0.06 5 TOTAL 3 Year 4 Cost 5 Discount Factor 315,000 40,000 0.94 37 ,600 45,000 0.89 40,050 49,000 0.84 41,160 55,000 0.79 43,450 55,000 0.75 41,250 Discounted Costs 315,000 558,560 9 Benefits 1D Discount Factor 11 Discounted Benefits 100,000 0.94 94,000 100,000 0.89 89,000 125,000 0.840 105,000 150,000 0.79 118,500 300,000 0.75 225,000 631,500 315,000 315,000 63840 76,000 75,050 183,750 245,000 13 Discounted Benefits-Cost 14 Cumulative Benefits-Cost 15 16 Discounted ROI 17 ROI 18 NPV: 19 Excel NPV: 2D Payback 56,400 60,000 48,950 55,000 112,990
Step by Step Solution
There are 3 Steps involved in it

Get step-by-step solutions from verified subject matter experts