

Question: Looking at the graph and raw data are there trends or seasonality in the data? Year JAN FEB MAR APR MAY JUN JUL AUG SEP
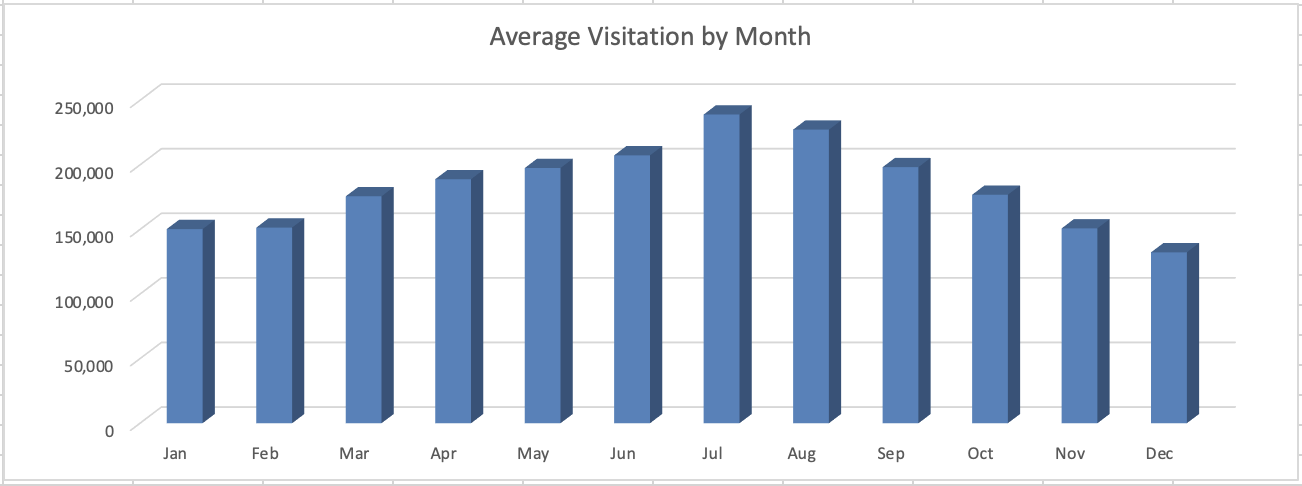
Looking at the graph and raw data are there trends or seasonality in the data?
| Year | JAN | FEB | MAR | APR | MAY | JUN | JUL | AUG | SEP | OCT | NOV | DEC | Total |
| 1979 | 141,287 | 127,316 | 131,821 | 148,935 | 121,618 | 136,736 | 145,882 | 137,992 | 129,642 | 93,488 | 89,810 | 84,608 | 1,489,135 |
| 1980 | 99,200 | 92,215 | 147,589 | 114,074 | 132,921 | 134,209 | 137,828 | 159,544 | 123,569 | 109,308 | 96,628 | 61,725 | 1,408,810 |
| 1981 | 105,418 | 100,962 | 98,529 | 117,147 | 145,696 | 133,618 | 134,388 | 140,269 | 97,818 | 94,996 | 83,067 | 70,541 | 1,322,449 |
| 1982 | 53,835 | 74,428 | 101,457 | 112,154 | 143,659 | 125,295 | 146,368 | 148,866 | 136,675 | 122,122 | 92,824 | 86,899 | 1,344,582 |
| 1983 | 101,204 | 101,205 | 88,181 | 111,403 | 138,871 | 137,880 | 138,095 | 140,113 | 133,012 | 128,233 | 110,344 | 96,210 | 1,424,751 |
| 1984 | 171,250 | 145,404 | 190,403 | 174,205 | 211,899 | 192,122 | 182,762 | 203,953 | 173,772 | 143,922 | 127,101 | 115,445 | 2,032,238 |
| 1985 | 182,905 | 191,802 | 182,350 | 162,409 | 170,264 | 174,758 | 175,662 | 160,590 | 184,883 | 157,730 | 132,622 | 115,640 | 1,991,615 |
| 1986 | 151,774 | 98,463 | 141,038 | 180,705 | 202,859 | 205,117 | 213,986 | 206,530 | 167,335 | 189,875 | 175,244 | 120,473 | 2,053,399 |
| 1987 | 164,232 | 160,906 | 192,213 | 191,168 | 203,963 | 173,674 | 211,227 | 195,646 | 191,952 | 170,672 | 153,009 | 118,128 | 2,126,790 |
| 1988 | 177,746 | 204,382 | 201,951 | 161,961 | 157,642 | 186,945 | 249,665 | 226,233 | 202,538 | 194,303 | 148,024 | 130,460 | 2,241,850 |
| 1989 | 183,965 | 150,694 | 170,302 | 201,826 | 219,611 | 179,454 | 231,001 | 206,983 | 196,399 | 149,347 | 161,043 | 153,782 | 2,204,407 |
| 1990 | 170,618 | 178,045 | 187,777 | 218,612 | 184,704 | 197,028 | 265,947 | 249,503 | 194,980 | 213,951 | 175,598 | 132,320 | 2,369,083 |
| 1991 | 180,459 | 187,778 | 184,430 | 211,098 | 218,858 | 215,268 | 255,118 | 248,818 | 191,103 | 196,946 | 177,657 | 129,371 | 2,396,904 |
| 1992 | 200,290 | 183,082 | 206,255 | 247,976 | 267,977 | 217,505 | 283,872 | 230,250 | 235,662 | 197,829 | 169,242 | 140,009 | 2,579,949 |
| 1993 | 195,038 | 171,310 | 183,268 | 217,276 | 240,706 | 245,358 | 275,412 | 287,156 | 296,940 | 190,246 | 152,336 | 106,188 | 2,561,234 |
| 1994 | 214,125 | 154,162 | 239,191 | 218,859 | 218,024 | 225,874 | 230,216 | 284,010 | 203,537 | 214,616 | 132,217 | 131,701 | 2,466,532 |
| 1995 | 94,143 | 170,123 | 132,375 | 228,254 | 205,159 | 223,178 | 269,407 | 209,272 | 221,818 | 173,470 | 160,406 | 120,764 | 2,208,369 |
| 1996 | 143,142 | 131,945 | 207,165 | 258,456 | 178,282 | 235,303 | 255,142 | 255,317 | 200,412 | 164,619 | 135,198 | 107,417 | 2,272,398 |
| 1997 | 124,645 | 178,503 | 225,543 | 217,581 | 276,693 | 241,043 | 247,451 | 276,605 | 198,883 | 219,679 | 145,835 | 153,086 | 2,505,547 |
| 1998 | 130,758 | 106,204 | 188,113 | 218,231 | 296,892 | 222,826 | 300,576 | 255,835 | 221,039 | 249,018 | 152,098 | 135,819 | 2,477,409 |
| 1999 | 138,977 | 196,265 | 206,183 | 211,143 | 214,981 | 220,295 | 267,402 | 252,637 | 181,659 | 152,313 | 97,044 | 161,732 | 2,300,631 |
| 2000 | 123,625 | 137,115 | 212,117 | 203,365 | 204,792 | 229,926 | 264,286 | 232,922 | 211,813 | 179,655 | 158,043 | 167,677 | 2,325,336 |
| 2001 | 141,148 | 148,069 | 187,075 | 199,356 | 212,707 | 215,843 | 262,308 | 245,253 | 177,410 | 287,873 | 100,078 | 45,642 | 2,222,762 |
| 2002 | 137,154 | 153,191 | 210,712 | 205,291 | 216,027 | 207,960 | 259,820 | 234,248 | 196,474 | 263,499 | 158,182 | 153,135 | 2,395,693 |
| 2003 | 150,110 | 163,621 | 182,810 | 186,718 | 204,097 | 238,617 | 256,622 | 220,514 | 207,405 | 205,073 | 124,254 | 85,041 | 2,224,882 |
| 2004 | 136,673 | 140,312 | 195,010 | 164,187 | 179,231 | 207,700 | 184,379 | 184,379 | 218,453 | 124,688 | 122,658 | 102,385 | 1,960,055 |
| 2005 | 103,889 | 124,371 | 165,304 | 109,678 | 198,577 | 211,955 | 211,955 | 213,646 | 204,021 | 183,830 | 170,248 | 91,111 | 1,988,585 |
| 2006 | 137,118 | 121,205 | 132,413 | 127,688 | 191,900 | 179,309 | 300,953 | 223,711 | 193,587 | 184,577 | 156,124 | 116,498 | 2,065,083 |
| 2007 | 152,304 | 118,450 | 168,363 | 228,764 | 190,919 | 174,160 | 285,596 | 207,737 | 211,794 | 162,577 | 160,256 | 145,374 | 2,206,294 |
| 2008 | 113,512 | 141,172 | 221,265 | 146,061 | 199,900 | 185,933 | 240,856 | 264,886 | 185,301 | 175,737 | 225,947 | 147,633 | 2,248,203 |
| 2009 | 153,148 | 112,675 | 183,606 | 219,270 | 205,495 | 186,860 | 232,840 | 240,675 | 203,489 | 162,838 | 150,404 | 119,346 | 2,170,646 |
| 2010 | 141,130 | 130,657 | 174,338 | 177,257 | 161,422 | 222,308 | 187,843 | 206,654 | 213,930 | 147,301 | 169,774 | 134,657 | 2,067,271 |
| 2011 | 146,102 | 135,088 | 168,704 | 175,047 | 209,193 | 194,023 | 246,406 | 208,204 | 199,616 | 166,879 | 138,285 | 141,569 | 2,129,116 |
| 2012 | 180,783 | 173,627 | 153,346 | 214,869 | 204,151 | 224,230 | 266,027 | 217,586 | 243,441 | 196,786 | 162,076 | 175,741 | 2,412,663 |
| 2013 | 215,820 | 196,794 | 243,732 | 277,013 | 210,476 | 253,070 | 246,176 | 255,708 | 264,318 | 113,352 | 164,689 | 200,660 | 2,641,808 |
| 2014 | 139,923 | 150,947 | 211,113 | 195,999 | 250,626 | 231,603 | 234,814 | 282,417 | 231,882 | 173,760 | 154,743 | 176,117 | 2,433,944 |
| 2015 | 208,010 | 184,222 | 221,922 | 206,595 | 206,934 | 241,471 | 258,908 | 268,145 | 212,659 | 185,120 | 166,522 | 140,598 | 2,501,106 |
| 2016 | 125,413 | 206,245 | 161,811 | 249,196 | 194,562 | 249,625 | 284,922 | 208,978 | 240,578 | 189,213 | 162,052 | 165,847 | 2,438,442 |
| 2017 | 134,229 | 132,448 | 177,915 | 257,158 | 219,010 | 245,833 | 296,031 | 267,437 | 234,234 | 174,509 | 175,717 | 142,148 | 2,456,669 |
| 2018 | 158,858 | 177,931 | 178,822 | 204,688 | 213,117 | 238,095 | 268,741 | 320,852 | 150,009 | 152,343 | 166,946 | 167,320 | 2,397,722 |
| 2019 | 151,683 | 164,704 | 137,162 | 231,762 | 215,032 | 223,966 | 234,944 | 239,426 | 214,052 | 133,226 | 162,712 | 156,632 | 2,265,301 |
| 2020 | 135,994 | 165,759 | 96,576 | 28,749 | 48,314 | 247,290 | 368,186 | 269,293 | 193,828 | 238,092 | 227,161 | 233,182 | 2,252,424 |
| 2021 | 216,696 | 196,743 | 186,718 | 206,228 | 208,868 | 256,505 | 268,036 | 294,293 | 256,226 | 264,931 | 211,007 | 171,847 | 2,738,098 |
| 2022 | 164,080 | 159,311 | 172,580 | 193,344 | 198,176 | 236,826 | 272,551 | 219,313 | 175,463 | 191,221 | 183,236 | 170,101 | 2,336,202 |
| 2023 | 172,551 | 177,603 | 156,978 | 169,980 |
Average Visitation bv Month
Step by Step Solution
There are 3 Steps involved in it
1 Expert Approved Answer
Step: 1 Unlock

Question Has Been Solved by an Expert!
Get step-by-step solutions from verified subject matter experts
Step: 2 Unlock
Step: 3 Unlock