

Question: Looking at this plot, you might think that something is wrong. Data Select a description that best describes the situation. More of the data points
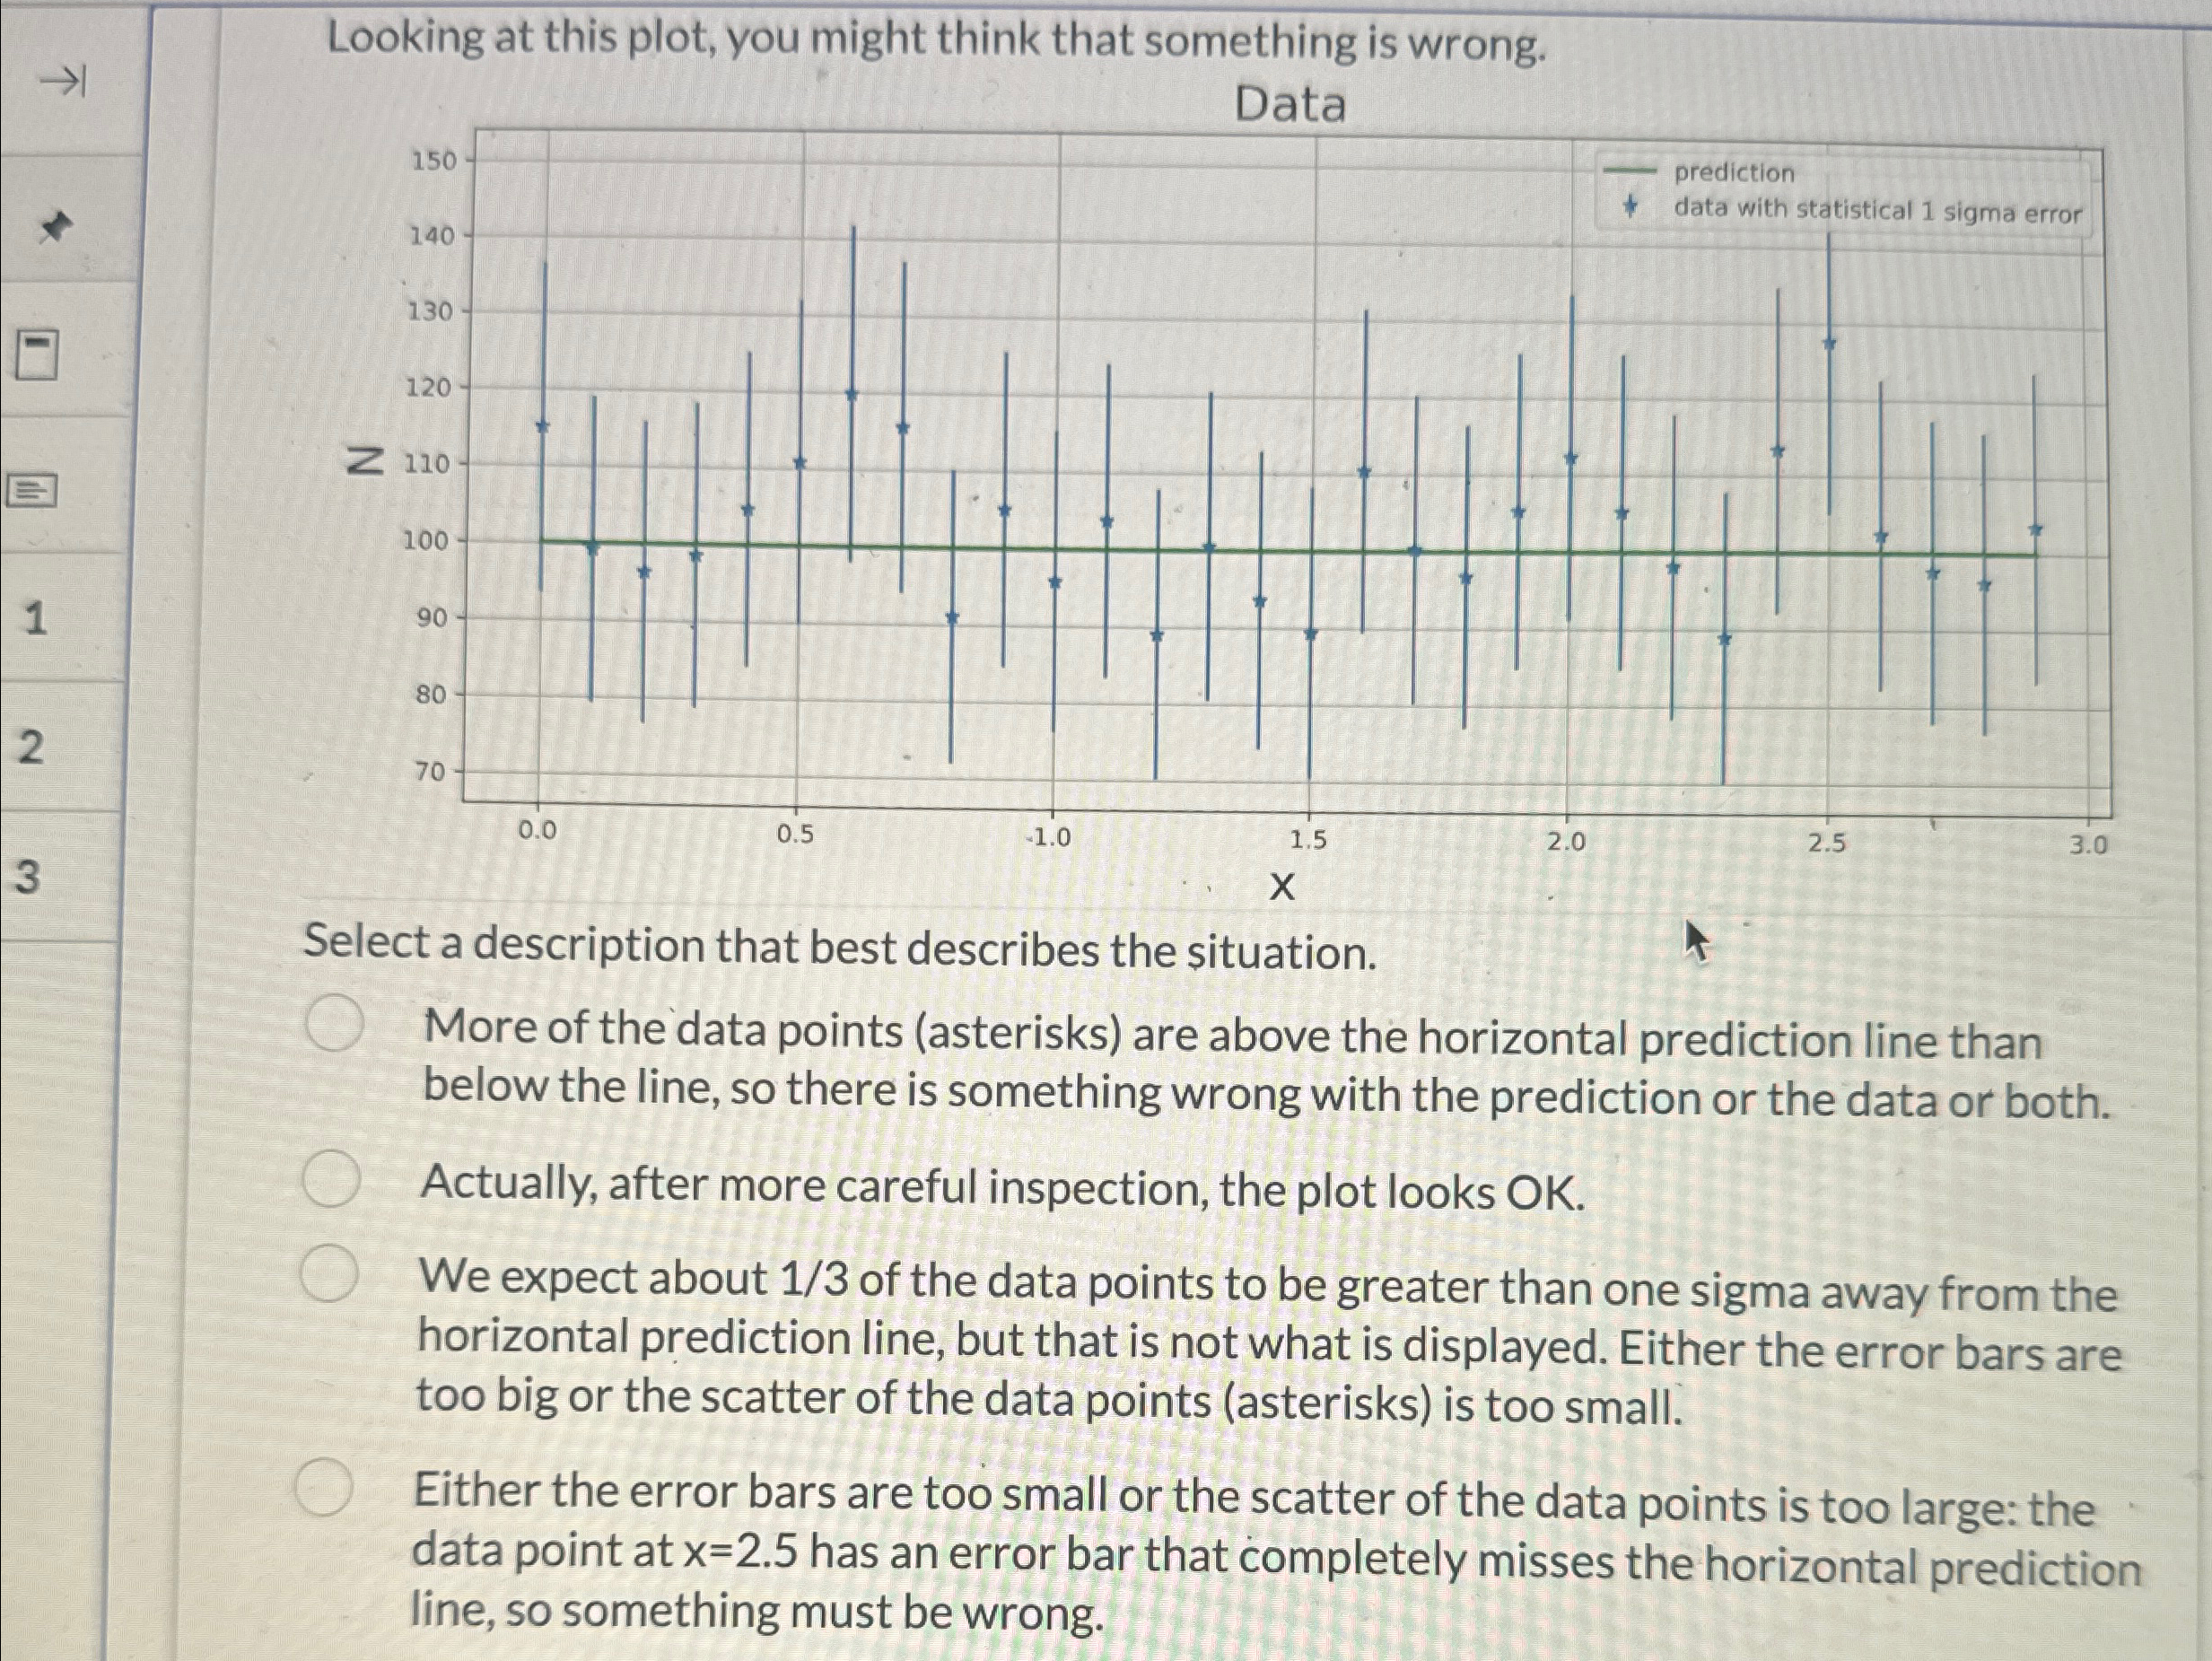
Looking at this plot, you might think that something is wrong.
Data
Select a description that best describes the situation.
More of the data points asterisks are above the horizontal prediction line than below the line, so there is something wrong with the prediction or the data or both.
Actually, after more careful inspection, the plot looks OK
We expect about of the data points to be greater than one sigma away from the horizontal prediction line, but that is not what is displayed. Either the error bars are too big or the scatter of the data points asterisks is too small.
Either the error bars are too small or the scatter of the data points is too large: the data point at has an error bar that completely misses the horizontal prediction line, so something must be wrong.
Step by Step Solution
There are 3 Steps involved in it
1 Expert Approved Answer
Step: 1 Unlock

Question Has Been Solved by an Expert!
Get step-by-step solutions from verified subject matter experts
Step: 2 Unlock
Step: 3 Unlock