

Question: Looking for help on these 2 separate questions below. Thank you! A major flood occurs in Watertown and the demand for bottled water increases. The
Looking for help on these 2 separate questions below. Thank you!
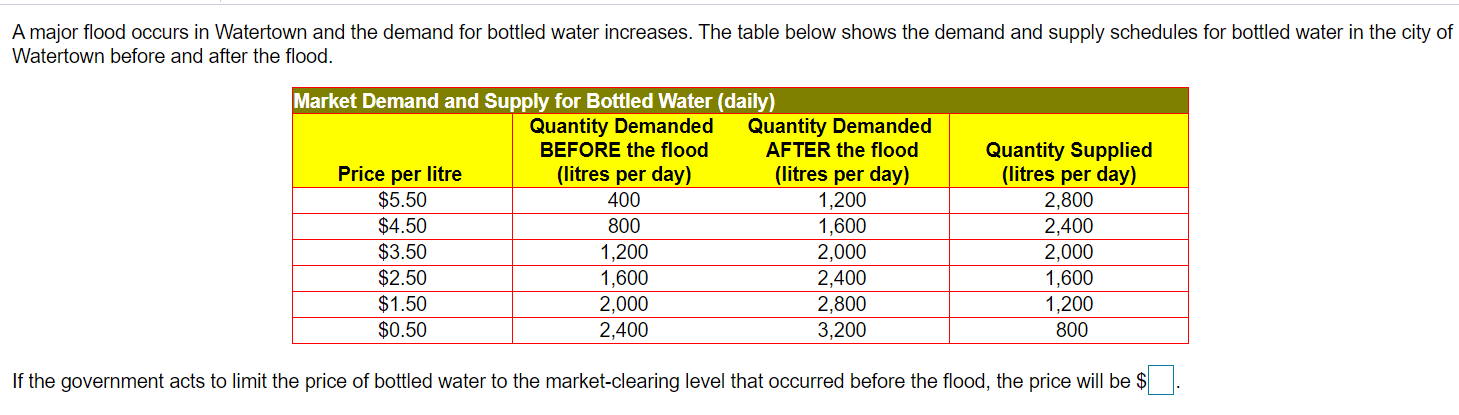
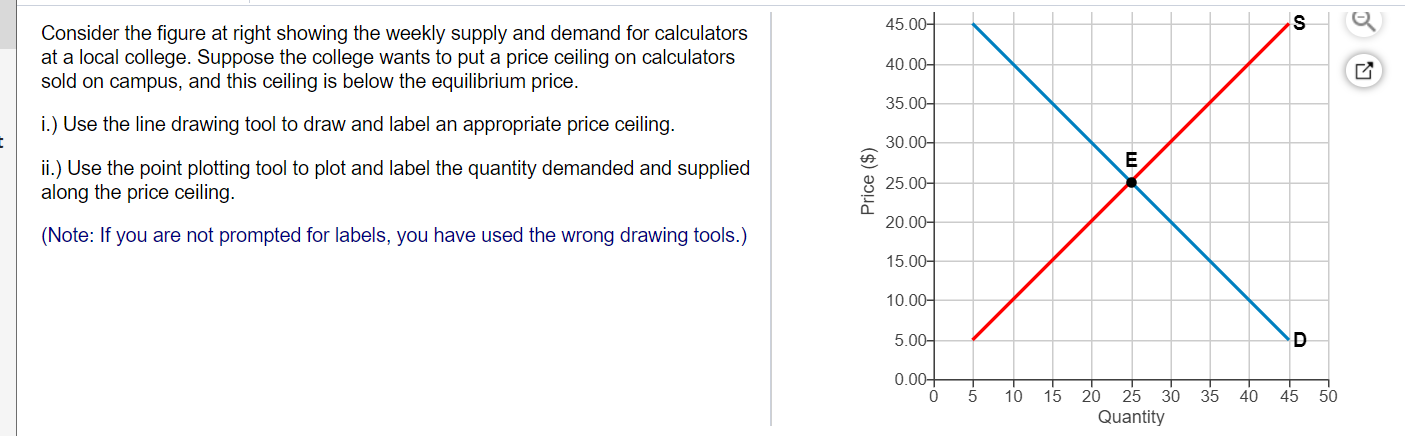
A major flood occurs in Watertown and the demand for bottled water increases. The table below shows the demand and supply schedules for bottled water in the city of Watertown before and after the flood. Market Demand and Supply for Bottled Water (daily) Quantity Demanded Quantity Demanded BEFORE the flood Price per litre AFTER the flood (litres per day) $5.50 (litres per day) Quantity Supplied (litres per day) 400 1,200 2,800 $4.50 800 1,600 2,400 $3.50 1,200 2,000 2,000 $2.50 1,600 2,400 $1.50 1,600 2,000 2,800 1,200 $0.50 2,400 3,200 800 If the government acts to limit the price of bottled water to the market-clearing level that occurred before the flood, the price will be $Consider the gure at right showing the weekly supply and demand for calculators at a local college. Suppose the college wants to put a price ceiling on calculators sold on campus, and this ceiling is below the equilibrium price. i.) Use the line drawing tool to draw and label an appropriate price ceiling. ii.) Use the point plotting tool to plot and label the quantity demanded and supplied along the price ceiling. (Note: If you are not prompted for labels. you have used the wrong drawing tools.) Price ($) 450 400 350 300 250 200 150 100 53 GD 0 5 10 D l5 20 25 30 35 4D 45 50 Quantity
Step by Step Solution
There are 3 Steps involved in it

Get step-by-step solutions from verified subject matter experts