Question: Looking for help to find opportunites section for SWOT analysis for company L. Thanks Industry 92 COMPARATIVE COMPETITIVE EFFORTS Year 12 A North America Competitive
Looking for help to find opportunites section for SWOT analysis for company L. Thanks
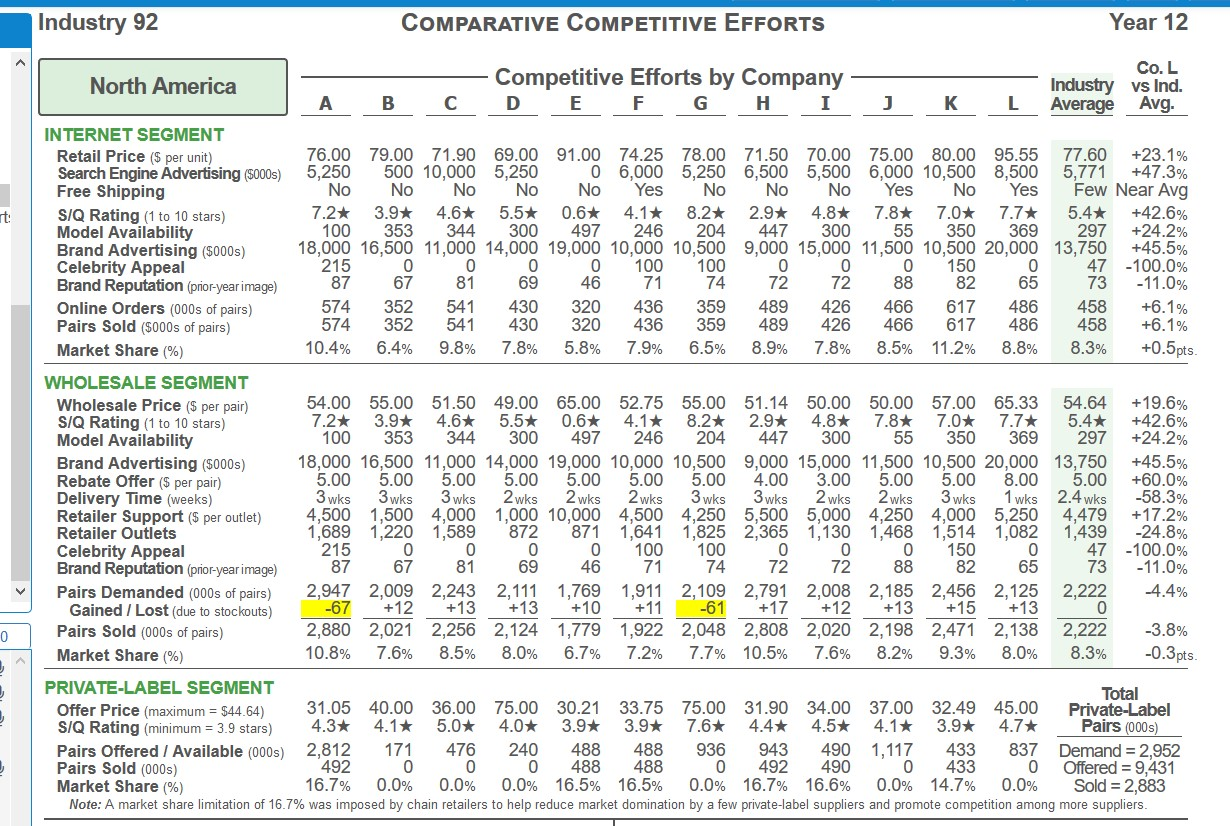
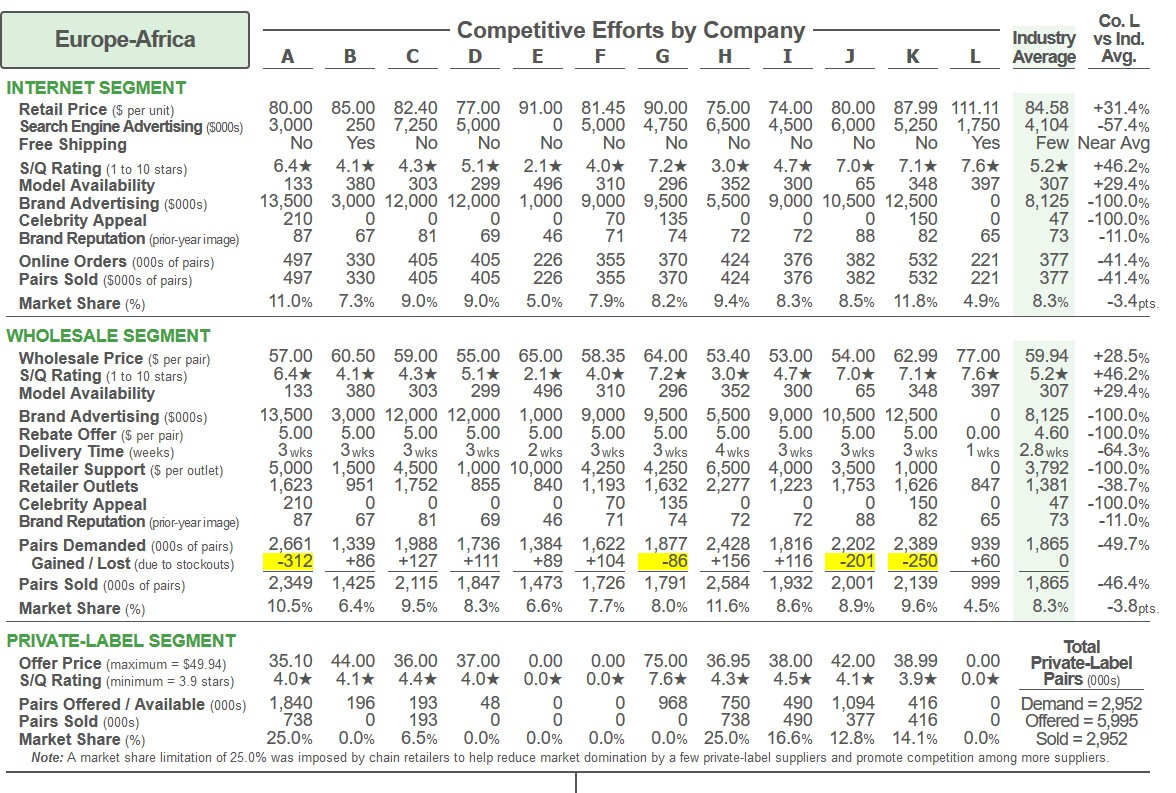
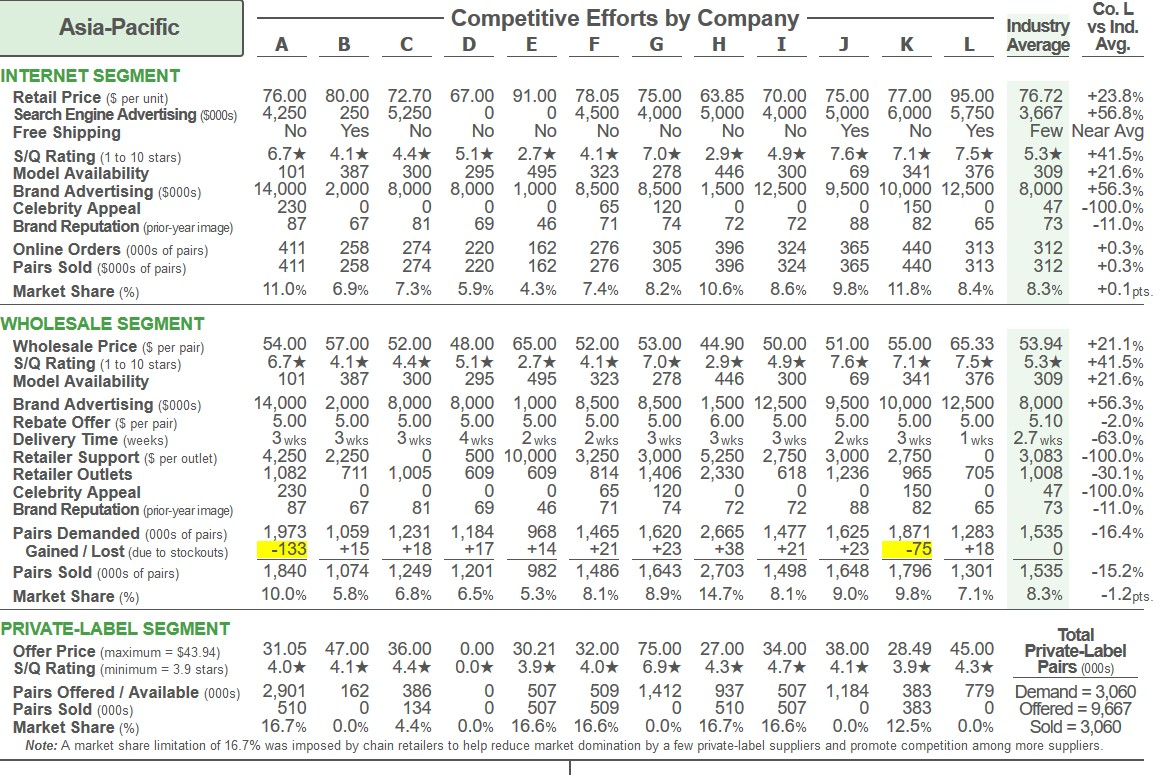
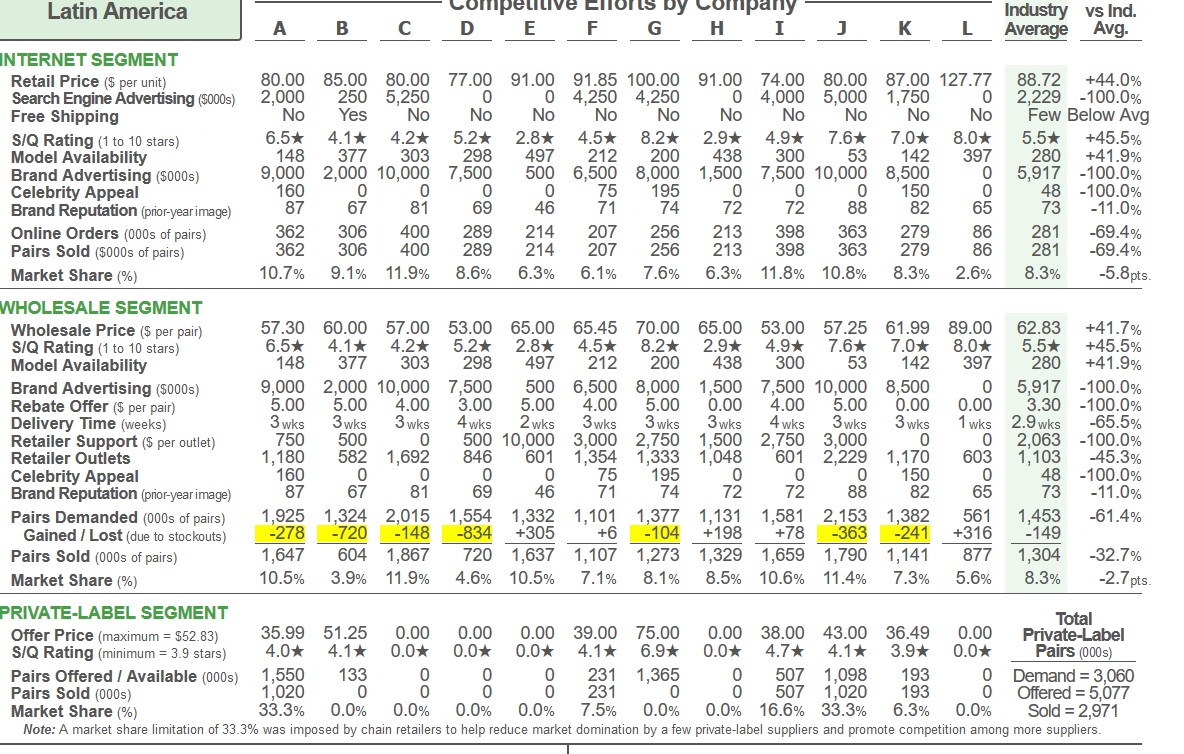
Industry 92 COMPARATIVE COMPETITIVE EFFORTS Year 12 A North America Competitive Efforts by Company DE F G H Co. L Industry vs Ind. Average Avg. A B I J K L 76.00 79.00 71.90 69.00 91.00 74.25 78.00 71.50 70.00 75.00 80.00 95.55 77.60 +23.1% 5,250 500 10,000 5,250 0 6,000 5,250 6,500 5,500 6,000 10,500 8,500 5,771 +47.3% No No No No No Yes No No No Yes No Yes Few Near Avg 7.2* 3.9% 4.6* 5.5* 0.6* 4.1* 8.2* 2.9% 4.8* 7.8* 7.0* 7.7* 5.4* +42.6% 100 353 344 300 497 246 204 447 300 55 350 369 297 +24.2% 18,000 16,500 11,000 14,000 19,000 10,000 10,500 9,000 15,000 11,500 10,500 20,000 13,750 +45.5% 215 0 0 0 0 100 100 0 0 0 150 0 47 -100.0% 87 67 81 69 46 71 74 72 72 88 82 65 73 -11.0% 574 352 541 430 320 436 359 489 426 466 617 486 458 +6.1% 574 352 541 430 320 436 359 489 426 466 617 486 458 +6.1% 10.4% 6.4% 9.8% 7.8% 5.8% 7.9% 6.5% 8.9% 7.8% 8.5% 11.2% 8.8% 8.3% +0.5pts. INTERNET SEGMENT Retail Price ($ per unit) Search Engine Advertising (5000s) Free Shipping S/Q Rating (1 to 10 stars) Model Availability Brand Advertising ($000s) Celebrity Appeal Brand Reputation (prior-year image) Online Orders (000s of pairs) Pairs Sold (5000s of pairs) Market Share (%) WHOLESALE SEGMENT Wholesale Price (s per pair) S/Q Rating (1 to 10 stars) Model Availability Brand Advertising (5000s) Rebate Offer ($ per pair) Delivery Time (weeks) Retailer Support ($ per outlet) Retailer Outlets Celebrity Appeal Brand Reputation (prior-year image) Pairs Demanded (000s of pairs) Gained / Lost (due to stockouts) Pairs Sold (000s of pairs) Market Share (%) 54.00 55.00 51.50 49.00 65.00 52.75 55.00 51.14 50.00 50.00 57.00 65.33 54.64 +19.6% 7.2* 3.9* 4.6* 5.5* 0.6* 4.1* 8.2* 2.9% 4.8* 7.8* 7.0* 7.7* 5.4* +42.6% 100 353 344 300 497 246 204 447 300 55 350 369 297 +24.2% 18,000 16,500 11,000 14,000 19,000 10,000 10,500 9,000 15,000 11,500 10,500 20,000 13,750 +45.5% 5.00 5.00 5.00 5.00 5.00 5.00 5.00 4.00 3.00 5.00 5.00 8.00 5.00 +60.0% 3 wks 3 wks 3 wks 2 wks 2 wks 2 wks 3 wks 3 wks 2 wks 2 wks 3 wks 1 wks 2.4 wks -58.3% 4,500 1,500 4,000 1,000 10,000 4,500 4,250 5,500 5,000 4,250 4,000 5,250 4,479 +17.2% 1,689 1,220 1,589 872 871 1,641 1,825 2,365 1,130 1,468 1,514 1,082 1,439 -24.8% 215 0 0 0 0 100 100 0 0 0 150 0 47 -100.0% 87 67 81 69 46 71 74 72 72 88 82 65 73 -11.0% 2,947 2,009 2,243 2,111 1,769 1,911 2,109 2,791 2,008 2,185 2,456 2,125 2,222 -4.4% -67 +12 +13 +13 +10 +11 -61 +17 +12 +13 +15 +13 0 2,880 2,021 2,256 2,124 1,779 1,922 2,048 2,808 2,020 2,198 2,471 2,138 2,222 -3.8% 10.8% 7.6% 8.5% 8.0% 6.7% 7.2% 7.7% 10.5% 7.6% 8.2% 9.3% 8.0% 8.3% -0.3pts. 0 Total PRIVATE-LABEL SEGMENT Offer Price (maximum = $44.64) 31.05 40.00 36.00 75.00 30.21 33.75 75.00 31.90 34.00 37.00 32.49 45.00 Private Label S/Q Rating (minimum = 3.9 stars) 4.3* 4.1* 5.0* 4.0* 3.9% 3.9* 7.6* 4.4* 4.5* 4.1* 3.9* 4.7* Pairs (000) Pairs Offered / Available (000s) 2,812 171 476 240 488 488 943 490 1,117 433 837 Demand = 2,952 Pairs Sold (000s) 492 0 0 0 488 488 0 492 490 0 433 0 Offered = 9,431 Market Share (%) 16.7% 0.0% 0.0% 0.0% 16.5% 16.5% 0.0% 16.7% 16.6% 0.0% 14.7% 0.0% Sold = 2,883 Note: A market share limitation of 16.7% was imposed by chain retailers to help reduce market domination by a few private-label suppliers and promote competition among more suppliers. 936 Co.L Europe-Africa Competitive Efforts by Company Industry vs Ind. A B D E F G H I J K L Average Avg. INTERNET SEGMENT Retail Price ($ per unit) 80.00 85.00 82.40 77.00 91.00 81.45 90.00 75.00 74.00 80.00 87.99 111.11 84.58 +31.4% Search Engine Advertising (5000s) 3,000 250 7,250 5,000 0 5,000 4,750 6,500 4,500 6,000 5,250 1,750 4,104 -57.4% Free Shipping No Yes No No No No No No No No No Yes Few Near Avg S/Q Rating (1 to 10 stars) 6.4* 4.1* 4.3* 5.1* 2.1* 4.0* 7.2* 3.0* 4.7* 7.0* 7.1* 7.6* 5.2* +46.2% Model Availability 133 380 303 299 496 310 296 352 300 65 348 397 307 +29.4% Brand Advertising (5000s) 13,500 3,000 12,000 12,000 1,000 9,000 9,500 5,500 9,000 10,500 12,500 0 8,125 -100.0% Celebrity Appeal 210 0 0 0 0 70 135 0 0 0 150 0 47 -100.0% Brand Reputation (prior-year image) 87 67 81 69 46 71 74 72 72 88 82 65 73 -11.0% Online Orders (000s of pairs) 497 330 405 405 226 355 370 424 376 382 532 221 377 -41.4% Pairs Sold (5000s of pairs) 497 330 405 405 226 355 370 424 376 382 532 221 377 -41.4% Market Share (%) 11.0% 7.3% 9.0% 9.0% 5.0% 7.9% 8.2% 9.4% 8.3% 8.5% 11.8% 4.9% 8.3% -3.4pts. WHOLESALE SEGMENT Wholesale Price ($ per pair) 57.00 60.50 59.00 55.00 65.00 58.35 64.00 53.40 53.00 54.00 62.99 77.00 59.94 +28.5% S/Q Rating (1 to 10 stars) 6.4* 4.1* 4.3* 5.1* 2.1* 4.0 * 7.2* 3.0* 4.7* 7.0 7.1* 7.6* 5.2* +46.2% Model Availability 133 380 303 299 496 310 296 352 300 65 348 397 307 +29.4% Brand Advertising (5000s) 13,500 3,000 12,000 12,000 1,000 9,000 9,500 5,500 9,000 10,500 12,500 0 8,125 -100.0% Rebate Offer (s per pair) 5.00 5.00 5.00 5.00 5.00 5.00 5.00 5.00 5.00 5.00 5.00 4.60 -100.0% Delivery Time (weeks) 3 wks 3 wks 3 wks 3 wks 2 wks 3 wks 3 wks 4wks 3 wks 3 wks 3 wks 1 wks 2.8 wks -64.3% Retailer Support ($ per outlet) 5,000 1,500 4,500 1,000 10,000 4,250 4,250 6,500 4,000 3,500 1,000 0 3,792 -100.0% Retailer Outlets 1,623 951 1,752 855 840 1,193 1,632 2,277 1,223 1,753 1,626 847 1,381 -38.7% Celebrity Appeal 210 0 0 0 0 70 135 0 0 0 150 0 47 -100.0% Brand Reputation (pror-year image) 87 67 81 69 46 71 74 72 72 88 82 65 73 -11.0% Pairs Demanded (000s of pairs) 2,661 1,339 1,988 1,736 1,384 1,622 1,877 2,428 1,816 2,202 2,389 939 1,865 -49.7% Gained / Lost (due to stockouts) -312 +86 +127 +111 +89 +104 -86 +156 +116 -201 -250 +60 0 Pairs Sold (000s of pairs) 2,349 1,425 2,115 1,847 1,473 1,726 1,791 2,584 1,932 2,001 2,139 999 1,865 -46.4% Market Share (%) 10.5% 6.4% 9.5% 8.3% 6.6% 7.7% 8.0% 11.6% 8.6% 8.9% 9.6% 4.5% 8.3% -3.8 pts PRIVATE-LABEL SEGMENT Total Offer Price (maximum = $49.94) 35.10 44.00 36.00 37.00 0.00 0.00 75.00 36.95 38.00 42.00 38.99 0.00 Private-Label S/Q Rating (minimum = 3.9 stars) 4.0* 4.1* 4.4* 4.0* 0.0* 0.0* 7.6* 4.3* 4.5* 4.1* 3.9* 0.0* Pairs (000) Pairs Offered / Available (000s) 1,840 196 193 48 0 0 968 750 490 1,094 416 0 Demand = 2,952 Pairs Sold (000s) 738 0 193 0 0 0 738 490 377 416 0 Offered = 5,995 Market Share (%) 25.0% 0.0% 6.5% 0.0% 0.0% 0.0% 0.0% 25.0% 16.6% 12.8% 14.1% 0.0% Sold = 2,952 Note: A market share limitation of 25.0% was imposed by chain retailers to help reduce market domination by a few private-label suppliers and promote competition among more suppliers. 0.00 8 Asia-Pacific Competitive Efforts by Company DE F I Co.L Industry vs Ind. Average Avg. B G H J K L INTERNET SEGMENT Retail Price ($ per unit) Search Engine Advertising (5000s) Free Shipping S/Q Rating (1 to 10 stars) Model Availability Brand Advertising (5000s) Celebrity Appeal Brand Reputation (prior-year image) Online Orders (000s of pairs) Pairs Sold ($000s of pairs) Market Share %) 76.00 80.00 72.70 67.00 91.00 78.05 75.00 63.85 70.00 75.00 77.00 95.00 4,250 250 5,250 0 0 4,500 4,000 5,000 4,000 5,000 6,000 5,750 No Yes No No No No No No No Yes No Yes 6.7* 4.1* 4.4* 5.1* 2.7* 4.1* 7.0* 2.9% 4.9* 7.6* 7.1* 7.5* 101 387 300 295 495 323 278 446 300 69 341 376 14,000 2,000 8,000 8,000 1,000 8,500 8,500 1,500 12,500 9,500 10,000 12,500 230 0 0 0 0 65 120 0 0 0 150 0 87 67 81 69 46 71 74 72 72 88 82 65 411 258 274 220 162 276 305 396 324 365 440 313 411 258 274 220 162 276 305 396 324 365 440 313 11.0% 6.9% 7.3% 5.9% 4.3% 7.4% 8.2% 10.6% 8.6% 9.8% 11.8% 8.4% 76.72 +23.8% 3,667 +56.8% Few Near Avg 5.3* +41.5% 309 +21.6% 8,000 +56.3% 47 -100.0% 73 - 11.0% 312 +0.3% 312 +0.3% 8.3% +0.1 pts WHOLESALE SEGMENT Wholesale Price ($ per pair) 54.00 57.00 52.00 48.00 65.00 52.00 53.00 44.90 50.00 51.00 55.00 65.33 53.94 +21.1% S/Q Rating (1 to 10 stars) 6.7* 4.1* 4.4* 5.1* 2.7* 4.1* 7.0* 2.9* 4.9* 7.6* 7.1* 7.5* 5.3* +41.5% Model Availability 101 387 300 295 495 323 278 446 300 69 341 376 309 +21.6% Brand Advertising ($000s) 14,000 2,000 8,000 8,000 1,000 8,500 8,500 1,500 12,500 9,500 10,000 12,500 8,000 +56.3% Rebate Offer (s per pair) 5.00 5.00 5.00 5.00 5.00 5.00 5.00 6.00 5.00 5.00 5.00 5.00 5.10 -2.0% Delivery Time (weeks) 3 wks 3 wks 3 wks 4 wks 2 wks 2 wks 3 wks 3 wks 3 wks 2 wks 3 wks 1 wks 2.7 wks -63.0% Retailer Support ($ per outlet) 4,250 2,250 0 500 10,000 3,250 3,000 5,250 2,750 3,000 2,750 0 3,083 -100.0% Retailer Outlets 1,082 711 1,005 609 609 814 1,406 2,330 618 1,236 965 705 1,008 -30.1% Celebrity Appeal 230 0 0 0 0 65 120 0 0 0 150 0 47 -100.0% Brand Reputation (prior-year image) 87 67 81 69 46 71 74 72 72 88 82 65 73 -11.0% Pairs Demanded (000s of pairs) 1,973 1,059 1,231 1,184 968 1,465 1,620 2,665 1,477 1,625 1,871 1,283 1,535 -16.4% Gained / Lost (due to stockouts) -133 +18 +17 +14 +21 +38 +21 -75 +18 0 Pairs Sold (000s of pairs) 1,840 1,074 1,249 1,201 982 1,486 1,643 2,703 1,498 1,648 1,796 1,301 1,535 -15.2% Market Share (%) 10.0% 5.8% 6.8% 6.5% 5.3% 8.1% 8.9% 14.7% 8.1% 9.0% 9.8% 7.1% 8.3% -1.2 pts PRIVATE-LABEL SEGMENT Total Offer Price (maximum = $43.94) 31.05 47.00 36.00 0.00 30.21 32.00 75.00 27.00 34.00 38.00 28.49 45.00 Private-Label S/Q Rating (minimum = 3.9 stars) 4.0* 4.1* 4.4* 0.0* 3.9* 4.0* 6.9% 4.3* 4.7* 4.1* 3.9* 4.3* Pairs (000s) Pairs Offered / Available (000s) 2,901 162 386 0 507 509 1,412 937 507 383 779 Demand = 3,060 Pairs Sold (000s) 510 0 134 0 507 509 0 510 507 0 383 0 Offered = 9,667 Market Share %) 0.0% 4.4% 0.0% 16.6% 16.6% 0.0% 16.7% 16.6% 0.0% 12.5% 0.0% Sold = 3,060 Note: A market share limitation of 16.7% was imposed by chain retailers to help reduce market domination by a few private-label suppliers and promote competition among more suppliers. +15 +23 +23 1,184 16.7% -69.4% Latin America Industry vs Ind. A B D E F G H I J K L Average Avg. INTERNET SEGMENT Retail Price ($ per unit) 80.00 85.00 80.00 77.00 91.00 91.85 100.00 91.00 74.00 80.00 87.00 127.77 88.72 +44.0% Search Engine Advertising (5000s) 2,000 250 5,250 0 0 4,250 4,250 0 4,000 5,000 1,750 0 2,229 -100.0% Free Shipping No Yes No No No No No No No No No No Few Below Avg S/Q Rating (1 to 10 stars) 6.5* 4.1* 4.2* 5.2* 2.8* 4.5% 8.2* 2.9* 4.9* 7.6* 7.0* 8.0* 5.5* +45.5% Model Availability 148 377 303 298 497 212 200 438 300 53 142 397 280 +41.9% Brand Advertising (5000s) 9,000 2,000 10,000 7,500 500 6,500 8,000 1,500 7,500 10,000 8,500 0 5,917 -100.0% Celebrity Appeal 160 0 0 0 0 75 195 0 0 0 150 0 48 -100.0% Brand Reputation (prior-year image) 87 67 81 69 46 71 74 72 72 88 82 65 73 -11.0% Online Orders (000s of pairs) 362 306 400 289 214 207 256 213 398 363 279 86 281 -69.4% Pairs Sold ($000s of pairs) 362 306 400 289 214 207 256 213 398 363 279 86 281 Market Share (%) 10.7% 9.1% 11.9% 8.6% 6.3% 6.1% 7.6% 6.3% 11.8% 10.8% 8.3% 2.6% 8.3% -5.8 pts WHOLESALE SEGMENT Wholesale Price ($ per pair) 57.30 60.00 57.00 53.00 65.00 65.45 70.00 65.00 53.00 57.25 61.99 89.00 62.83 +41.7% S/Q Rating (1 to 10 stars) 6.5* 4.1* 4.2* 5.2* 2.8* 4.5* 8.2* 2.9% 4.9* 7.6* 7.0* 8.0* 5.5* +45.5% Model Availability 148 377 303 298 497 212 200 438 300 53 142 397 280 +41.9% Brand Advertising (5000s) 9,000 2,000 10,000 7,500 500 6,500 8,000 1,500 7,500 10,000 8,500 0 5,917 -100.0% Rebate Offer (s per pair) 5.00 5.00 4.00 3.00 5.00 4.00 5.00 0.00 4.00 5.00 0.00 0.00 3.30 -100.0% Delivery Time (weeks) 3 wks 3 wks 3 wks 4wks 2 wks 3 wks 3 wks 3 wks 4 wks 3 wks 3 wks 1 wks 2.9 wks -65.5% Retailer Support ($ per outlet) 750 500 0 500 10,000 3,000 2,750 1,500 2,750 3,000 0 0 2,063 -100.0% Retailer Outlets 1,180 582 1,692 846 601 1,354 1,333 1,048 601 2,229 1,170 603 1,103 -45.3% Celebrity Appeal 160 0 0 0 0 75 195 0 0 0 150 0 48 -100.0% Brand Reputation (prior-year image) 87 67 81 69 46 71 74 72 72 88 82 65 73 -11.0% Pairs Demanded (000s of pairs) 1,925 1,324 2,015 1,554 1,332 1,101 1,377 1,131 1,581 2,153 1,382 561 1,453 -61.4% Gained / Lost (due to stockouts) -278 -720 -148 -834 +305 +6 -104 +198 -363 -241 +316 -149 Pairs Sold (000s of pairs) 1,647 604 1,867 720 1,637 1,107 1,273 1,329 1,659 1,790 1,141 877 1,304 -32.7% Market Share (%) 10.5% 3.9% 11.9% 4.6% 10.5% 7.1% 8.1% 8.5% 10.6% 11.4% 7.3% 5.6% 8.3% -2.7 pts PRIVATE-LABEL SEGMENT Total Offer Price (maximum = $52.83) 35.99 51.25 0.00 0.00 0.00 39.00 75.00 0.00 38.00 43.00 36.49 0.00 Private-Label S/Q Rating (minimum = 3.9 stars) 4.0* 4.1* 0.0* 0.0* 0.0* 4.1* 6.9* 0.0* 4.7* 4.1* 3.9* 0.0* Pairs Offered / Available (000) 1,550 133 0 0 0 231 1,365 0 507 1,098 193 0 Demand = 3,060 Pairs Sold (000s) 1.020 0 0 0 0 231 0 0 507 1,020 193 0 Offered = 5,077 Market Share %) 33.3% 0.0% 0.0% 0.0% 0.0% 7.5% 0.0% 0.0% 16.6% 33.3% 6.3% 0.0% Sold = 2,971 Note: A market share limitation of 33.3% was imposed by chain retailers to help reduce market domination by a few private-label suppliers and promote competition among more suppliers. +78 Pairs (000s)


