

Question: resource: https://www.consensus-technology.com/internet-strategy.html Provide explanation to the following bullet points using the pictures below which has the numbers. LOOK at company ( (F )only. (Internet strategy)


resource: https://www.consensus-technology.com/internet-strategy.html
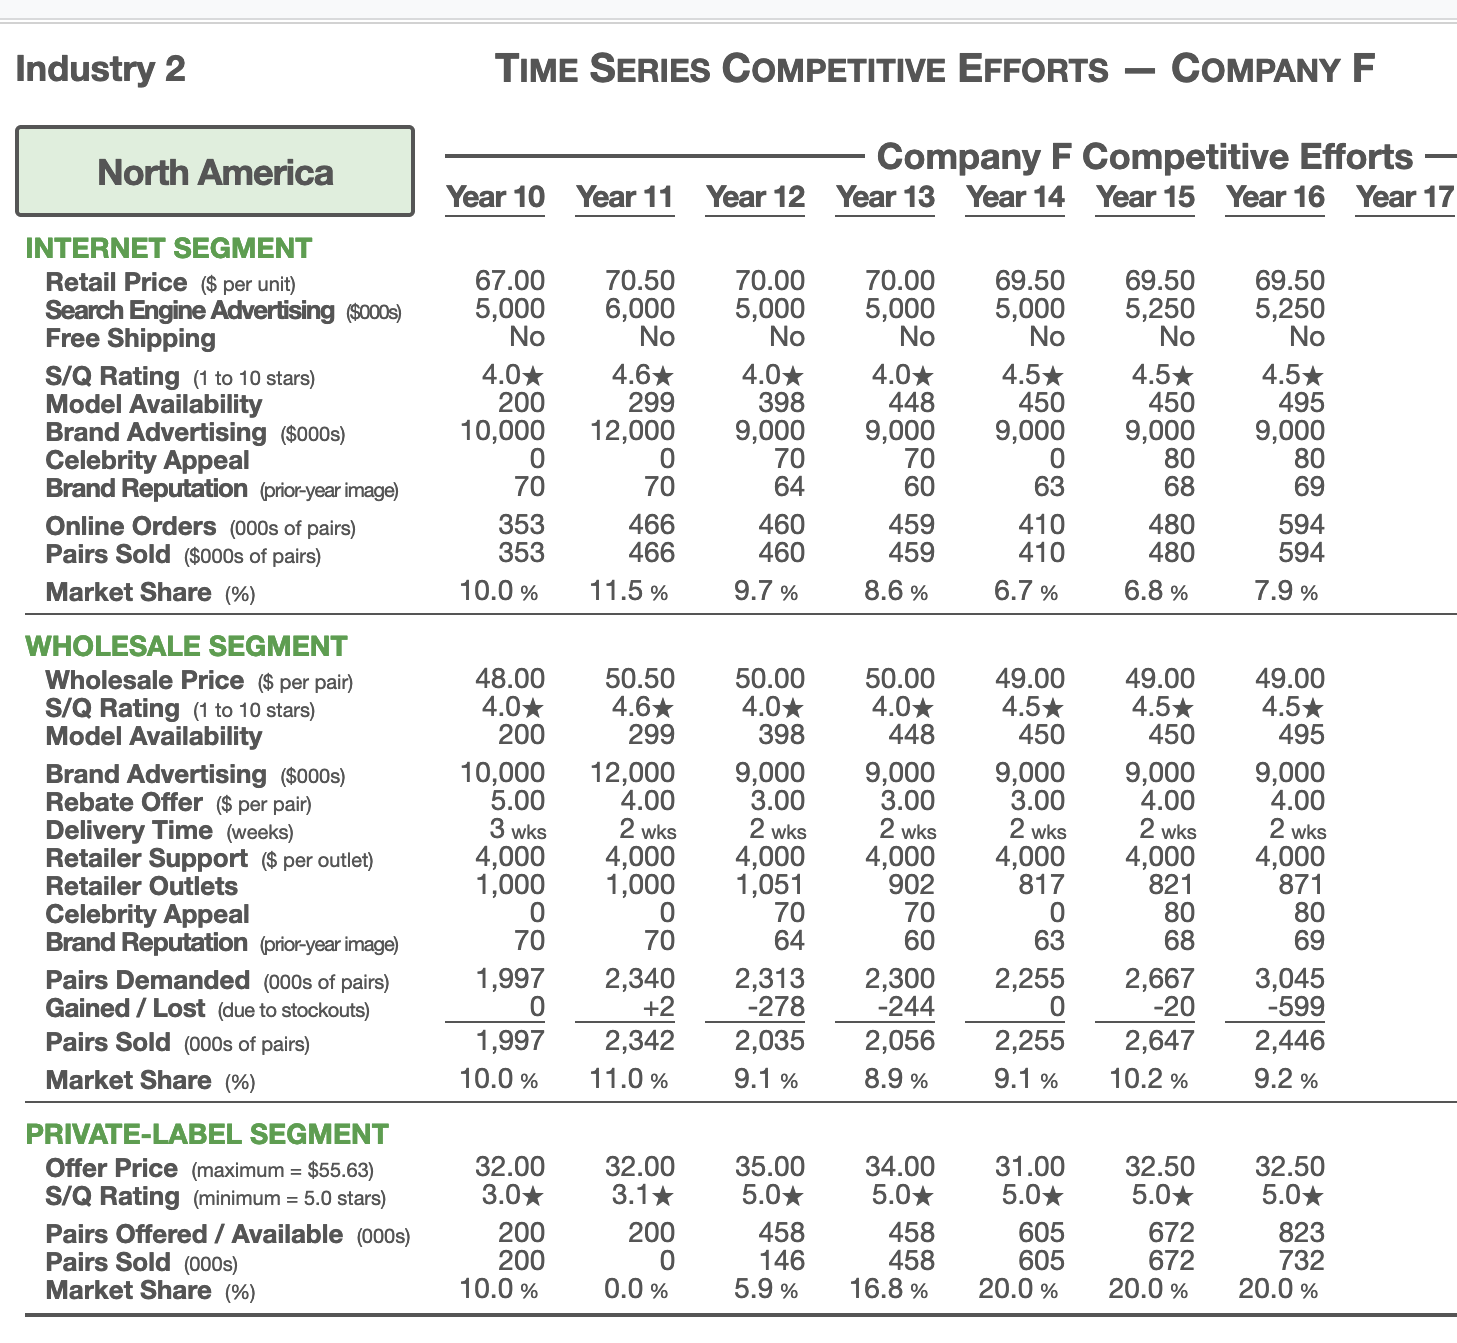
Provide explanation to the following bullet points using the pictures below which has the numbers. LOOK at company ( (F )only.
(Internet strategy)
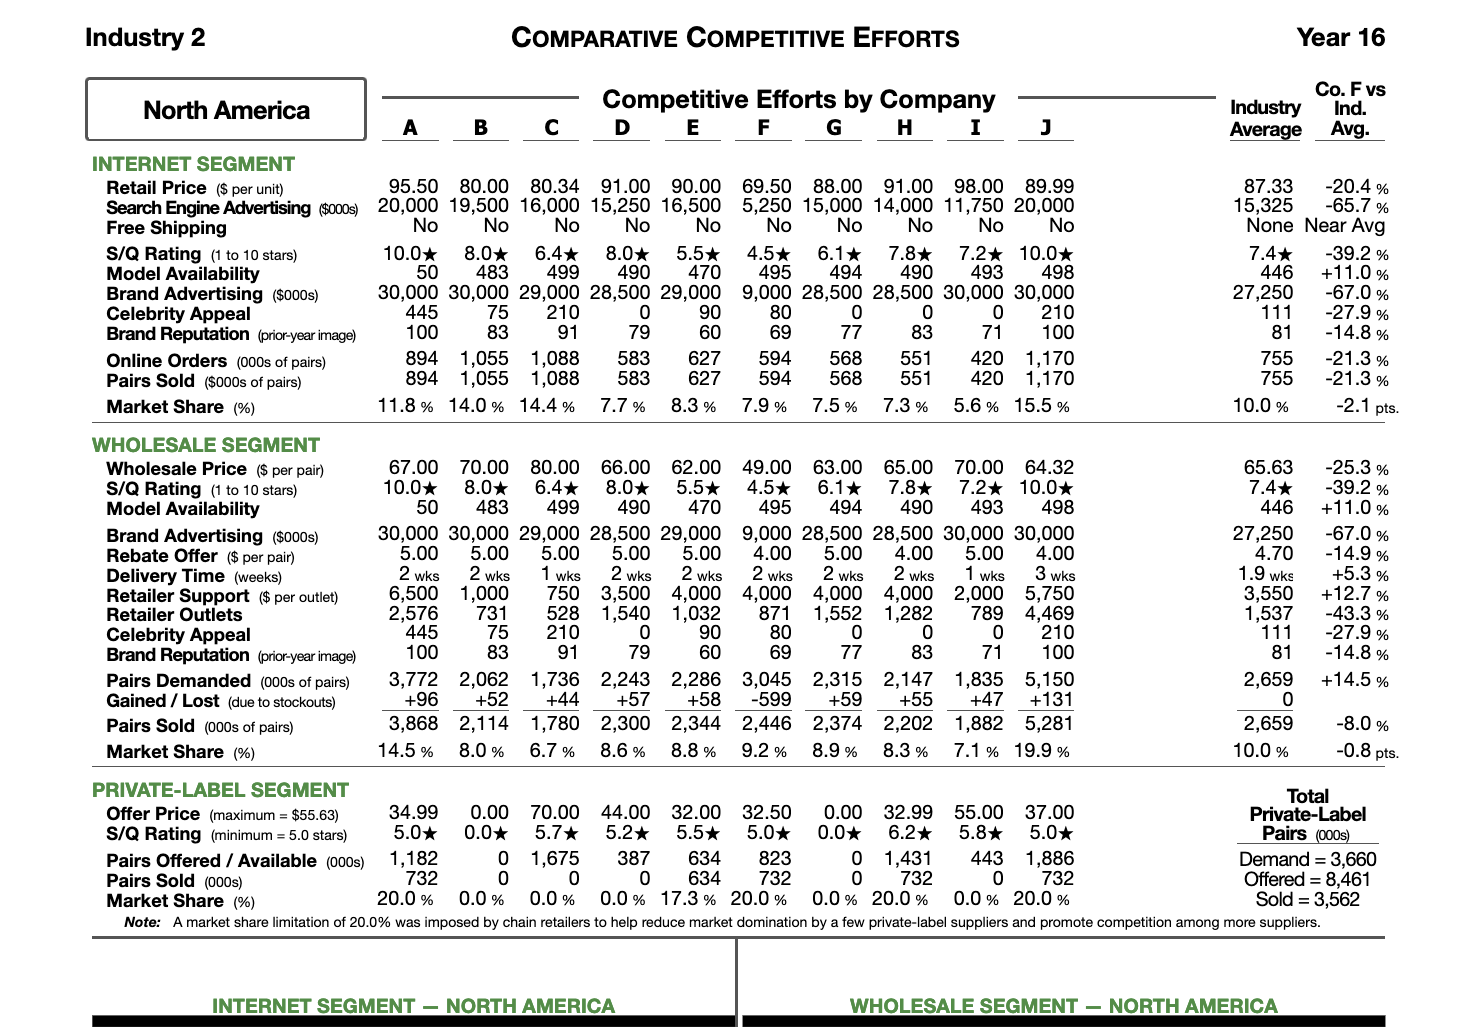
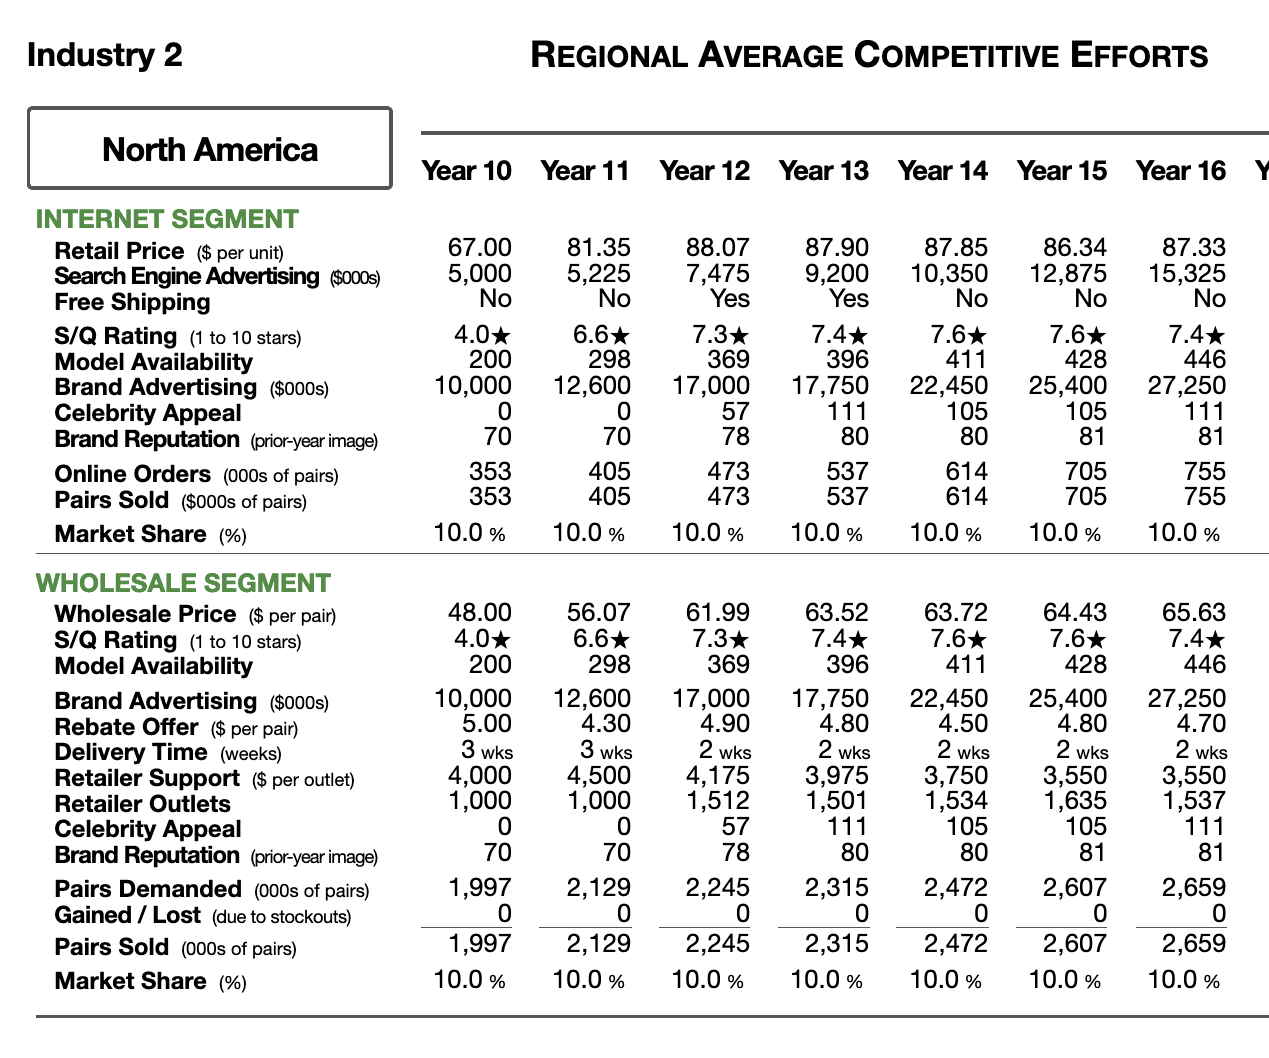
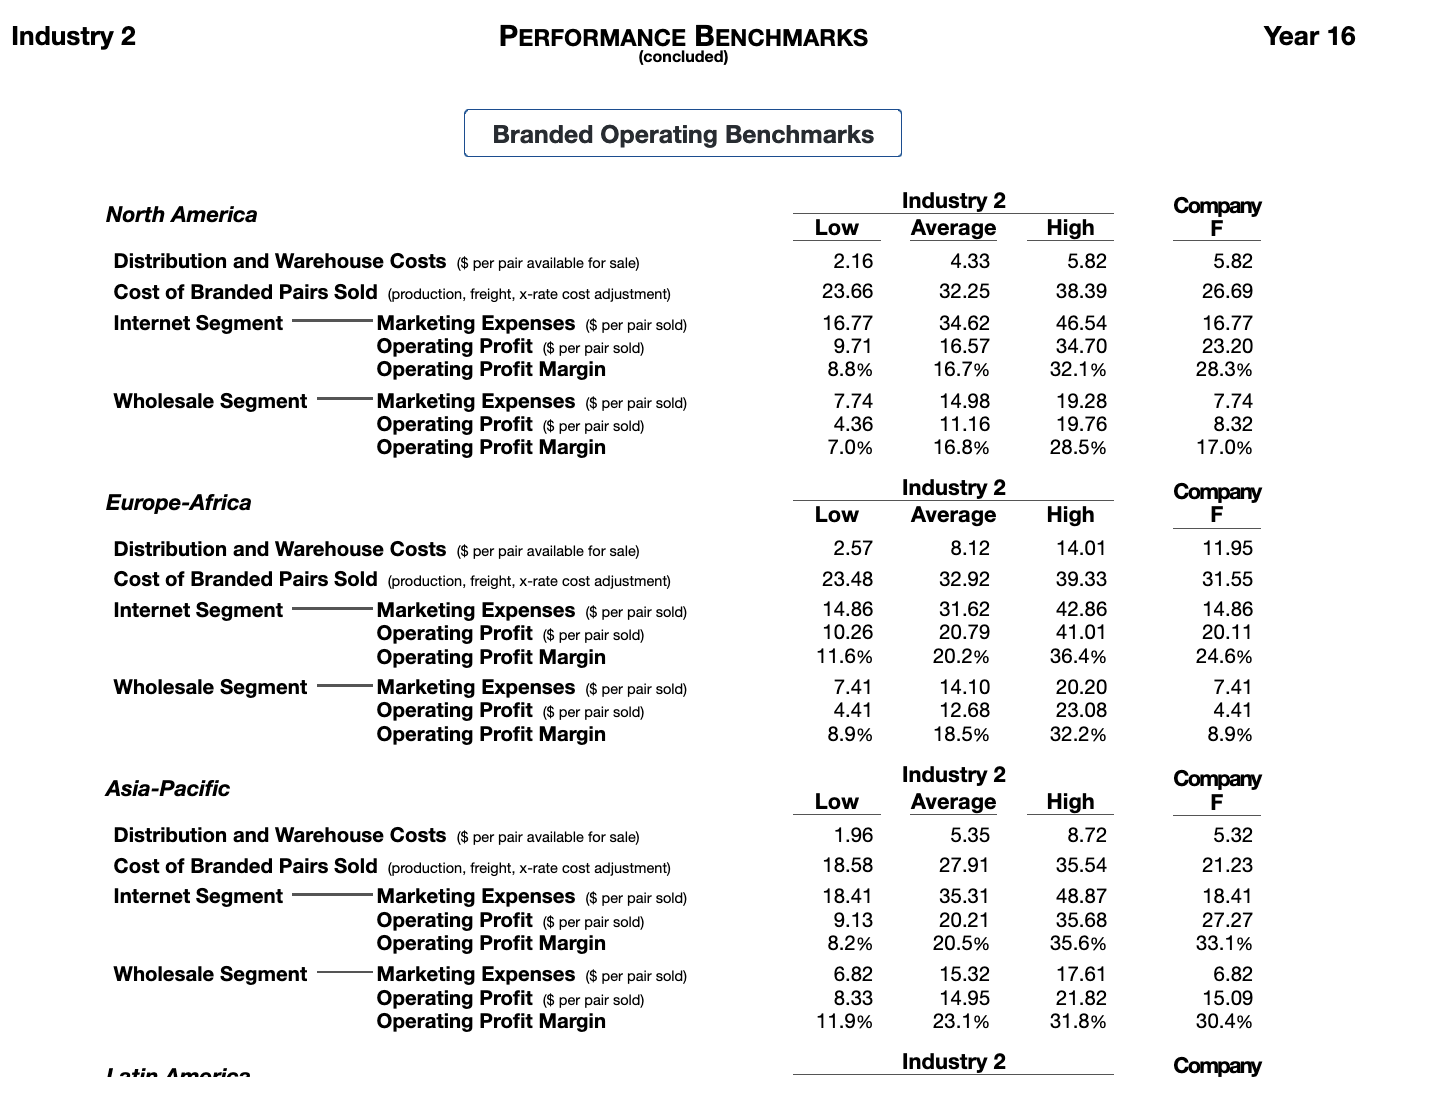
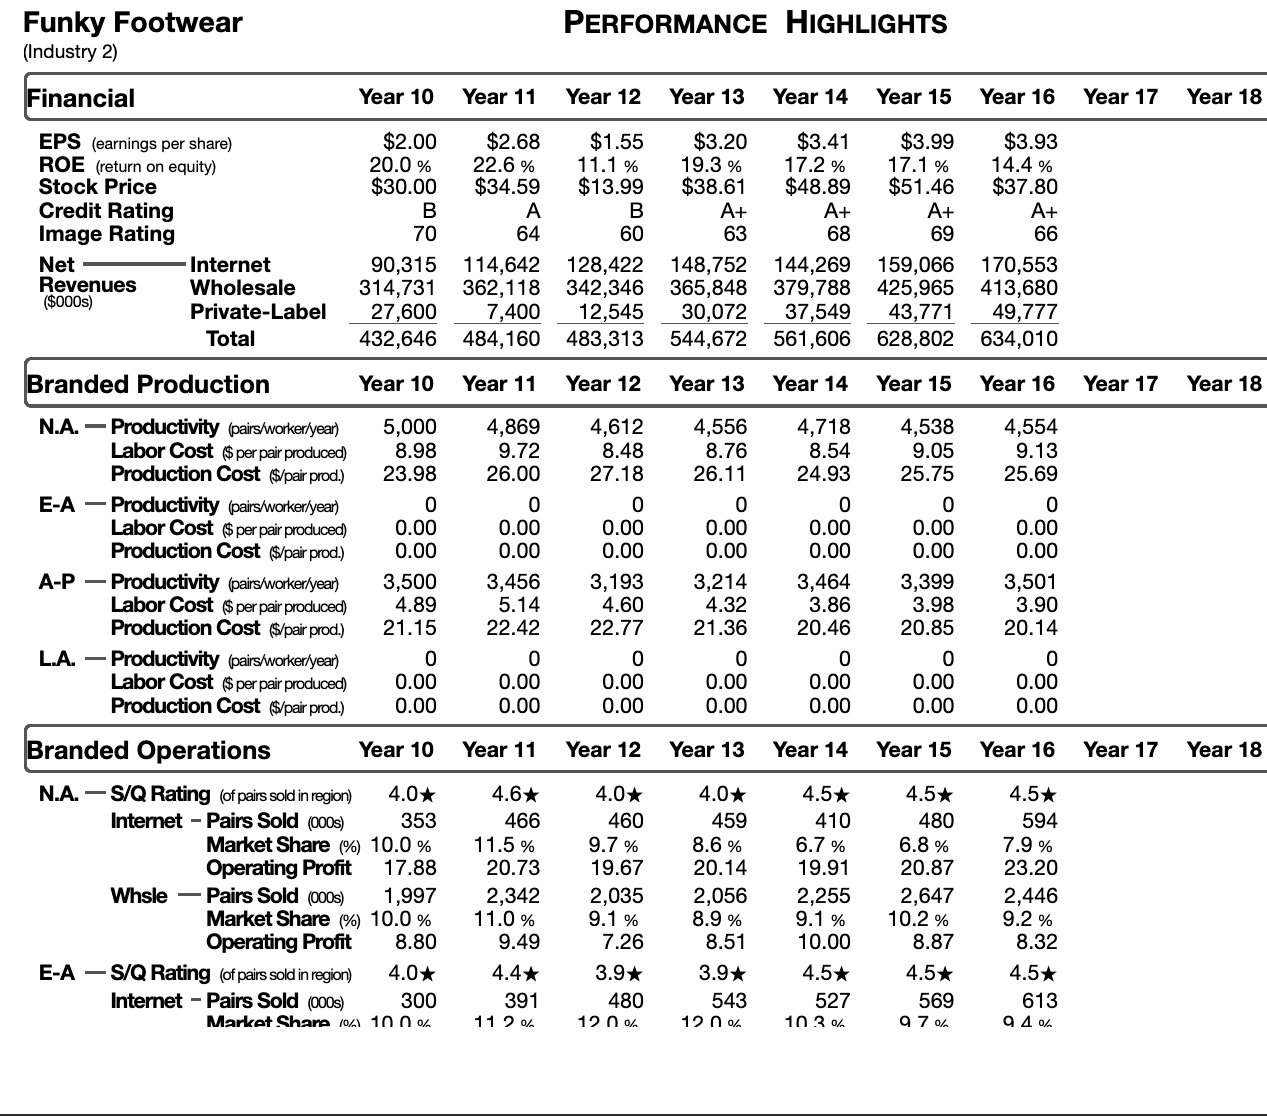
- 1) Overall cost leadership strategy and charts to show we we're the leader in this
- 2) Prioritized this market the least out of the three - because we assumed that other teams we're going to prioritize it more than private label (find evidence for this) Include related chart
- 3) Targeted Europe and North America the most then AP
- (Production strategy)
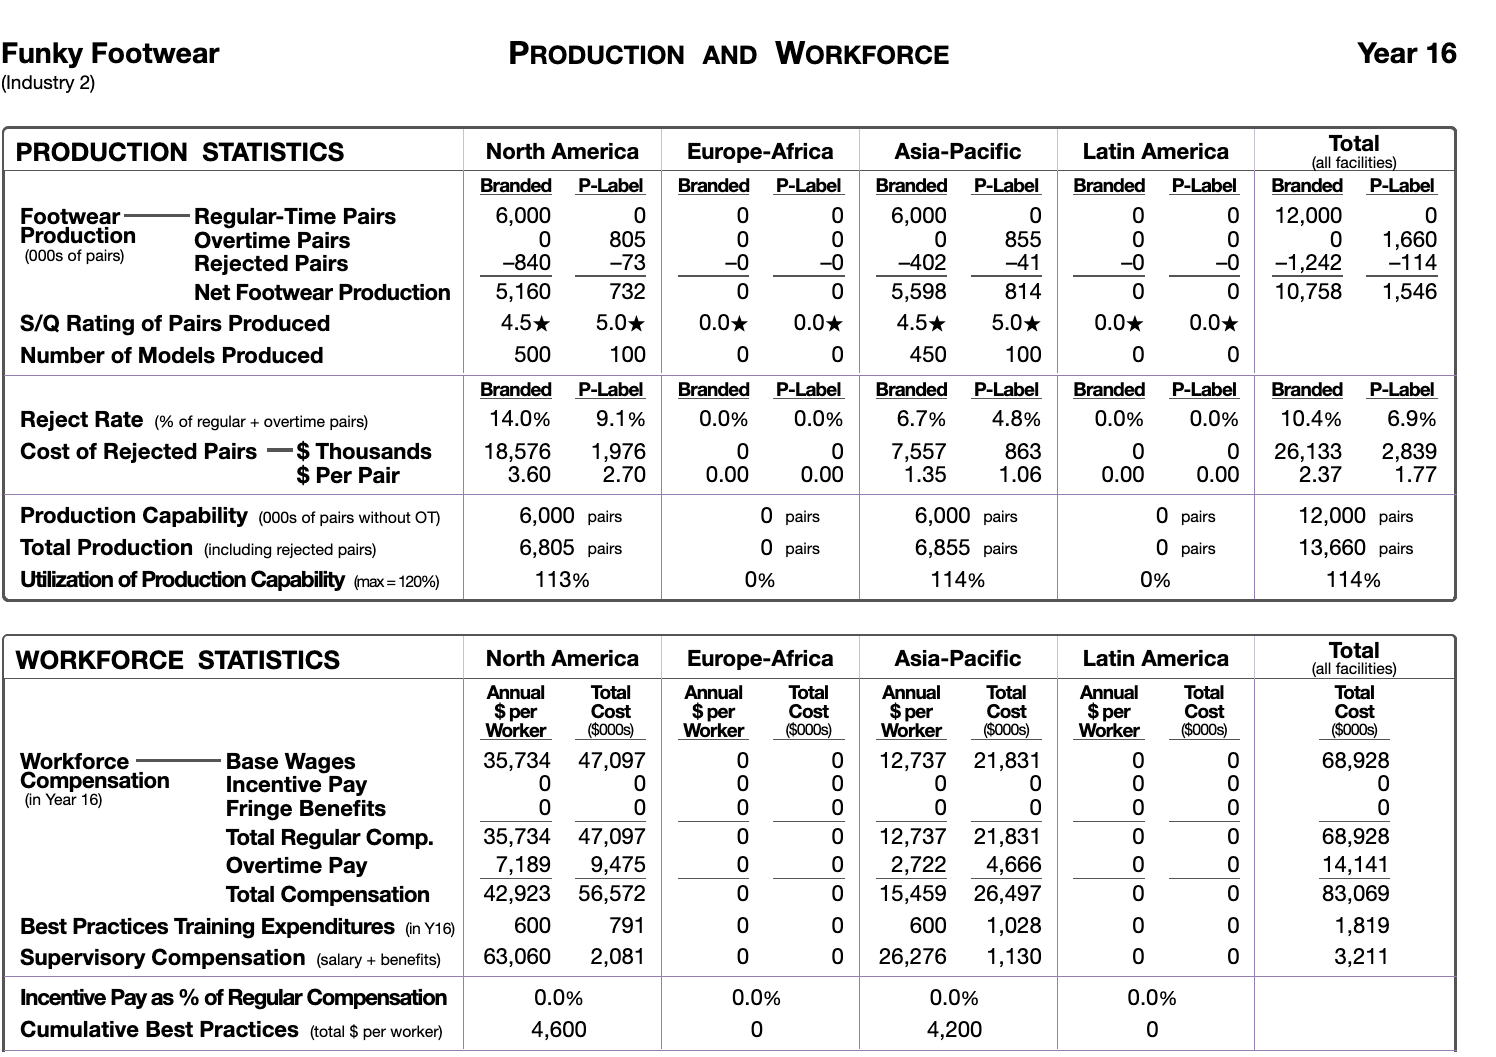
- 1)Include blunder in the beginning with building Europe facility
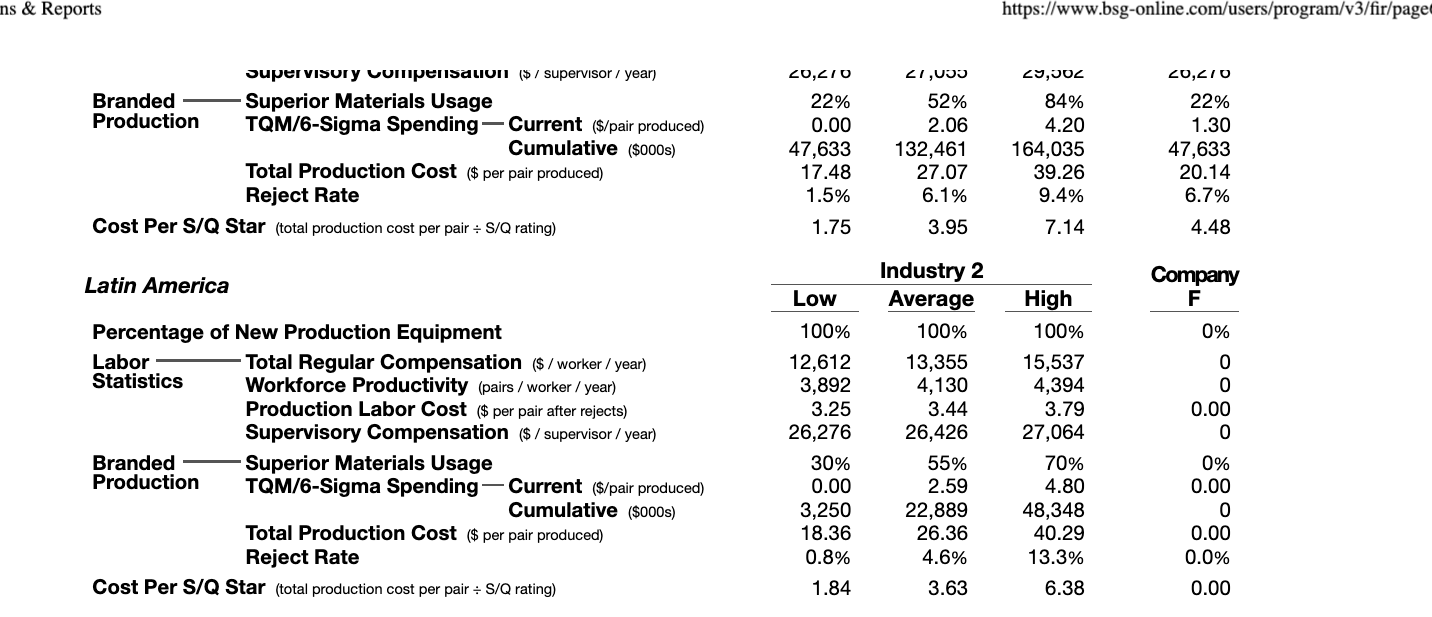
- 2)Pivot to overall cost leadership changed focus to
- Low workforce compensation
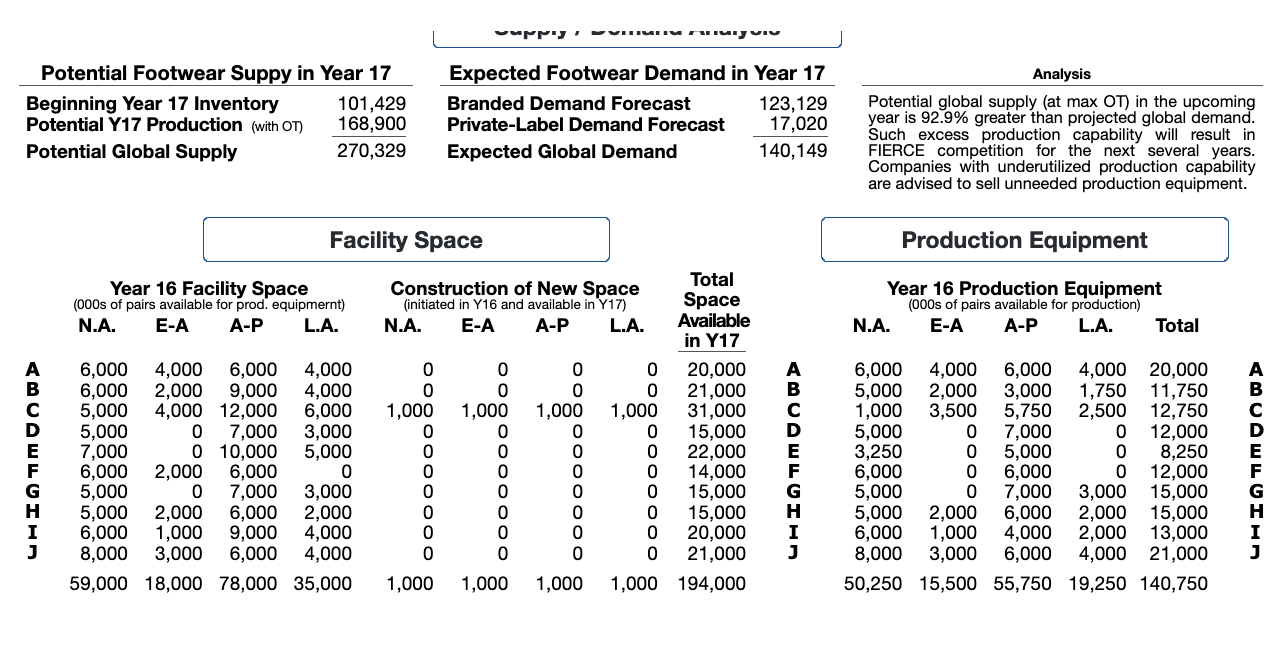
- Increased plant capacity as much as possible in current facilities
- Used overtime for private label
- Goal was to produce 1000 less shoes than predicted to demand which resulted in relativelylow carryover


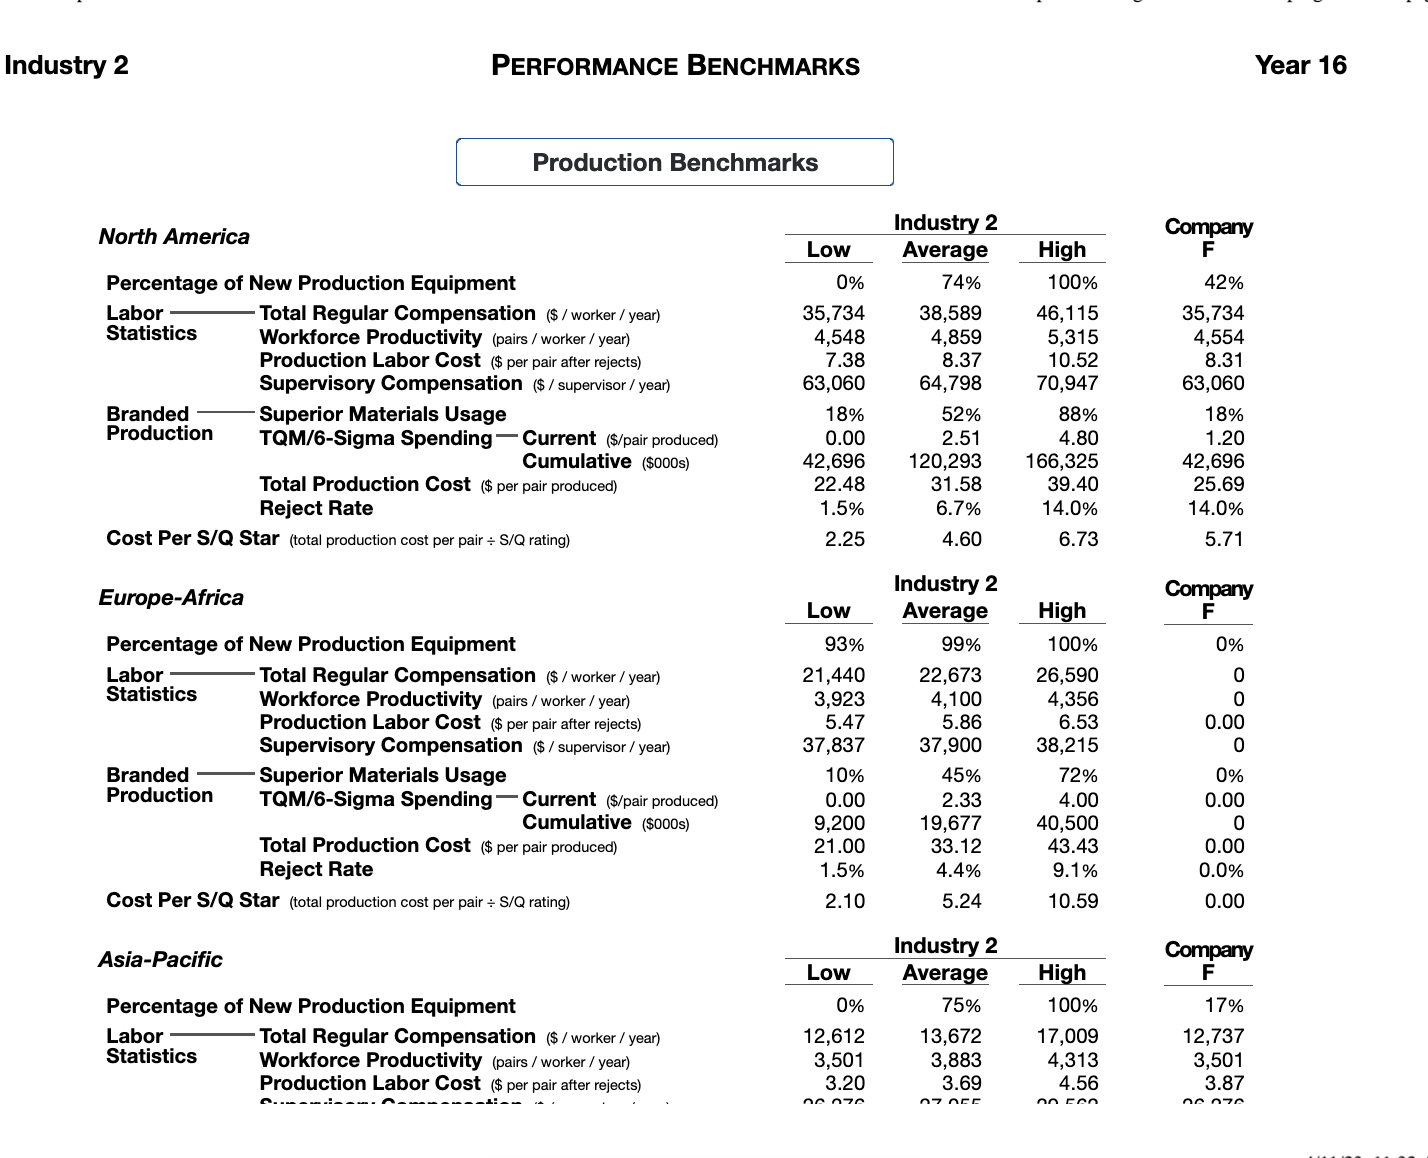
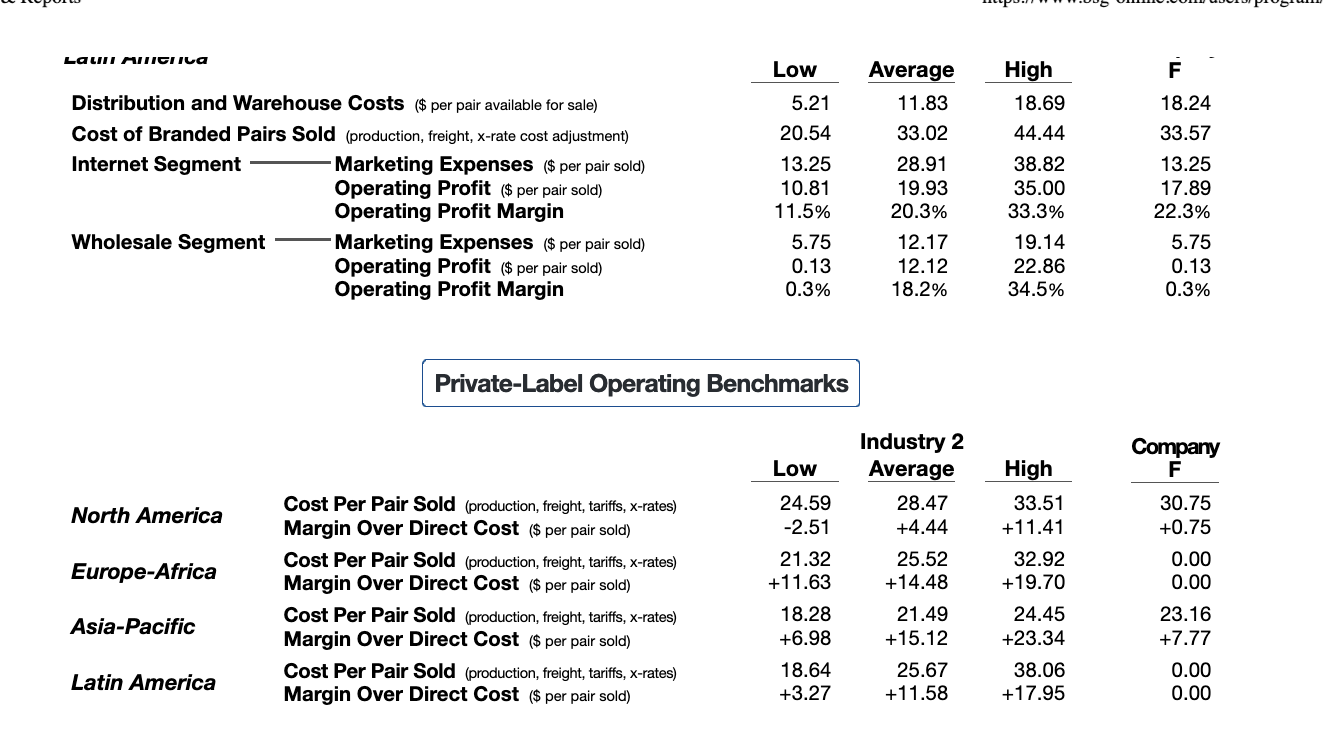
Industry 2 INDUSTRY OVERVIEW Year 16 Materials Prices Standard Superior Notes Base Prices of Materials ($ per pair) $6.00 $12.00 High industry-wide superior materials usage (49.2%) lead to superior materials Price Materials Usage -0.28 +2.21 prices that were 18.4% above the base and standard materials prices that were Adjustments Facilities Utilization 0.00 0.00 4.6% below the base. Industry-wide utilization of production capability (106.4%) had no impact on materials prices. Materials Prices in Year 16 ($ per pair) $5.72 $14.21 Footwear Production and Sales North Europe Asia Latin Average America Africa Pacific America or Total Notes Superior Materials Usage 50% 41% 51% 47% 19% % usage up 3.1 points from Year 15. Utilization of Production Capability 111.2% 100.0% 100.8% 115.5% 106.4% + % usage down 10.9 points from Year 15. Branded - Pairs Available (000s) 70,626 58,484 54,262 36,056 219,428 + 86.0% higher than Year 16 demand. Demand Forecast 33.894 29,218 26,831 27,027 116,970 From page 4 of FIR for Year 15. 000s of pairs) Actual 34, 140 29,190 27,330 27,340 118,000 Actual branded demand was 0.9% higher than forecast branded demand due to Pairs Sold (internet + wholesale) 34, 141 29,187 27,331 27,340 117,999 increased competitive intensity. Stockouts - No. of Companies 3 4 Extent to which orders for branded pairs Unfilled Orders (000s) 0 went unfilled due to inventory shortages at one or more companies. Private - Demand Forecast (000s of pairs) 3,660 3,660 4,070 4,070 15,460 From page 4 of FIR for Year 15. Label Pairs Offered (000s) 8,461 5,102 11,270 5,205 30.038 Private-label pairs offered was higher than Pairs Sold (000s) 3,562 3.341 3,993 4,070 14.966 actual private-label demand by 48.5%. Demand Forecast North Europe Asia Latin Global America Africa Pacific America Total Notes Branded Demand Year 17 35,013 29,847 29,022 29,247 123, 129 Global demand for Y11-Y15 is expected to (internet + wholesale Year 18 36,413 31,043 31,348 31,592 130,396 grow by 7%-9% annually, slowing to 5%-7% 37,865 32,281 33,860 34,123 138, 129 during Y16-Y20. The projected growth rates Year 19 are not the same for all regions, as shown in Private-Label Demand -Year 17 3,990 3,990 4,520 4,520 17,020 the table on page 5 of the Player's Guide. Year 18 4,350 4,350 5,020 5,020 18,740 Actual demand growth may vary from the forecast due to stronger or weaker competitive Year 19 4,740 4,740 5,570 5,570 20,620 efforts on the part of rival companies.Potential Footwear Suppy in Year 17 Expected Footwear Demand in Year 17 Analysis Beginning Year 17 Inventory 101,429 Branded Demand Forecast 123,129 Potential global supply (at max OT) in the upcoming Potential Y17 Production (with OT) 168,900 Private-Label Demand Forecast 17,020 year is 92.9% greater than projected global demand. Such excess production capability will result in Potential Global Supply 270,329 Expected Global Demand 140,149 FIERCE competition for the next several years. Companies with underutilized production capability are advised to sell unneeded production equipment. Facility Space Production Equipment Year 16 Facility Space Construction of New Space Total (000s of pairs available for prod. equipment) Space Year 16 Production Equipment initiated in Y16 and available in Y17) (000s of pairs available for production) N.A. E-A A-P L.A. N.A. E-A A-P L.A. Available N.A. E-A A-P L.A. Total in Y17 6,000 4,000 6,000 4,000 O 20,000 A 6,000 4,000 6,000 4,000 20,000 OO OO 6,000 2,000 9,000 4,000 21,000 5,000 2,000 3,000 1,750 11,750 5,000 4,000 12,000 6,000 1,000 1,000 1,000 1,000 31,000 1,000 3,500 5,750 2,500 12,750 5,000 0 7,000 3,000 15,000 5,000 0 7,000 O 12,000 7,000 0 10,000 5,000 OOO 22,000 3,250 0 5,000 8,250 UHIOTMOORD 6,000 2,000 6,000 0 UHIOTMOORD 14,000 6,000 O GRIOTMOOD 6,000 12,000 5,000 0 7,000 3,000 ooooooo ooooooo ooooooo 15,000 5,000 0 7,000 3,000 15,000 5,000 2,000 6,000 2,000 15,000 5,000 2,000 6,000 2,000 15,000 6,000 1,000 9,000 4,000 20,000 6,000 1,000 4,000 2,000 13,000 8,000 3,000 6,000 4,000 21,000 8,000 3,000 6,000 4,000 21,000 59,000 18,000 78,000 35,000 1,000 1,000 1,000 1,000 194,000 50,250 15,500 55,750 19,250 140,750Income Statement Data ($000s) Net Sales Revenues Cost of Warehouse Marketing Admin Operating Interest Income Net Internet Wholesale P-label Total Pairs Sold Expenses Expenses Expenses Profit Exp (Inc) Taxes Profit 337,201 1,024,332 112,055 1,492,578 481,291 97,307 395,693 31,070 487,217 11,525 142,708 332,984 323, 136 577,698 101,839 0 900,834 377,803 95,586 214,432 23,223 189,790 44,306 43,645 385,776 490,327 0 876, 103 365,772 103,432 224,342 24,219 158,338 45,350 33,896 79,092 206,611 579,946 109,445 912,722 495,763 66,718 188,471 24,215 137,555 4,149 38,821 90,583 HIGTMOOND 209,052 359,000 44, 190 612,242 297,523 59,381 162,721 20,869 71,748 44,004 6,823 15,921 UHIQTMDOWD 170,553 413,680 49,777 634,010 340,253 61,860 92,427 25,980 113,490 4,308 32,755 76,427 199,824 646,358 26,361 921,205 452,236 72,387 200,525 27,720 168,337 17,137 45,360 105,840 177,411 509, 117 24,182 719,631 296,523 67,373 193,217 29,471 133,047 57,148 22,770 53,129 173,363 515,826 0 689, 189 328,291 71,694 179,206 24.469 85,529 100,740 0 -15,211 389,913 881,543 200,384 1,508,023 685,440 101,977 285,793 32,073 402,740 5,254 119,246 278,240 257,284 599,783 56,639 926,654 412,090 79,772 213,683 26,331 194,779 33,392 48,602 111,884 Selected Balance Sheet Data ($000s) Assets Liabilities Shareholder Equity Cash Current Fixed Total Current Long-Term Total Beginning Stock Sale Earnings Ending On Hand Assets Assets Assets Liabilities Loans Liabilities Equity (Purchase) Retained Equity 314,583 755,334 1,069,917 127,688 149,280 276,968 733,845 -273,880 332,984 792,949 44,468 926, 178 508, 105 1,434,283 219,298 445,400 664,698 785,094 -117,348 101,839 769,585 62,562 810,383 723,188 1,533,571 104,911 448,603 553,515 989,174 -88,210 79,092 980,056 259,032 370,668 629,700 68,337 30,000 98,337 600,612 -69,249 531,363 3,815 299,713 426,477 726, 190 207,849 192,000 399,849 310,420 15,921 326,341 CHIATMDOWD GHIQTMOORD 38,693 194,945 473,538 668,483 44,674 69,300 113,974 504,472 -26,390 76,427 554,509 7,738 302,476 530,021 832,497 88,558 290,800 379,358 365, 149 -17,850 105,840 453, 139 75,618 689,452 451,048 1,140,500 188,845 647,000 835,845 332,906 -81,380 53, 129 304,655 1, 174,410 518,133 1,692,543 811,374 531,200 1,342,574 365, 180 -15,211 349,969 42,560 372,987 759,975 1,132,962 109,410 200,000 309,410 801,046 -232,105 254,611 823,552Industry 2 PERFORMANCE BENCHMARKS Year 16 Production Benchmarks Industry 2 Company North America Low Average High F Percentage of New Production Equipment 0% 74% 100% 42% Labor Total Regular Compensation ($ / worker / year) 35,734 38,589 46,115 35,734 Statistics Workforce Productivity (pairs / worker / year) 4.548 4,859 5,315 4,554 Production Labor Cost ($ per pair after rejects) 7.38 8.37 10.52 8.31 Supervisory Compensation ($ / supervisor / year) 63,060 64,798 70,947 63,060 Branded Superior Materials Usage 18% 52% 88% 18% Production TQM/6-Sigma Spending - Current ($/pair produced) 0.00 2.51 4.80 1.20 Cumulative ($000s) 42,696 120,293 166,325 42,696 Total Production Cost ($ per pair produced) 22.48 31.58 39.40 25.69 Reject Rate 1.5% 6.7% 14.0% 14.0% Cost Per S/Q Star (total production cost per pair : S/Q rating) 2.25 4.60 6.73 5.71 Industry 2 Company Europe-Africa Low Average High F Percentage of New Production Equipment 93% 99% 100% 0% Labor Total Regular Compensation ($ / worker / year) 21,440 22,673 26,590 0 Statistics Workforce Productivity (pairs / worker / year) 3,923 4,100 4.356 0 Production Labor Cost ($ per pair after rejects) 5.47 5.86 6.53 0.00 Supervisory Compensation ($ / supervisor / year) 37,837 37,900 38,215 0 Branded Superior Materials Usage 10% 45% 72% 0% Production TQM/6-Sigma Spending - Current ($/pair produced) 0.00 2.33 4.00 0.00 Cumulative ($000s) 9,200 19,677 40,500 0 Total Production Cost ($ per pair produced) 21.00 33.12 43.43 0.00 Reject Rate 1.5% 4.4% 9.1% 0.0% Cost Per S/Q Star (total production cost per pair + S/Q rating) 2.10 5.24 10.59 0.00 Industry 2 Company Asia-Pacific Low Average High F Percentage of New Production Equipment 0% 75% 100% 17% Labor Total Regular Compensation ($ / worker / year) 12,612 13,672 17,009 12,737 Statistics Workforce Productivity (pairs / worker / year) 3,501 3,883 4,313 3,501 Production Labor Cost ($ per pair after rejects) 3.20 3.69 4.56 3.87 no na no n70ns & Reports https://www.bsg-online.com/users/program/v3/fir/page Supervisory vulliperisalon ($/ supervisor / year) CO,210 Branded Superior Materials Usage 22% 52% 84% 22% Production TQM/6-Sigma Spending - Current ($/pair produced) 0.00 2.06 4.20 1.30 Cumulative ($000s) 47,633 132,461 164,035 47,633 Total Production Cost ($ per pair produced) 17.48 27.07 39.26 20.14 Reject Rate 1.5% 6.1% 9.4% 6.7% Cost Per S/Q Star (total production cost per pair : S/Q rating) 1.75 3.95 7.14 4.48 Industry 2 Latin America Company Low Average High F Percentage of New Production Equipment 100% 100% 100% 0% Labor Total Regular Compensation ($ / worker / year) 12,612 13,355 15,537 0 Statistics Workforce Productivity (pairs / worker / year) 3,892 4, 130 4,394 0 Production Labor Cost ($ per pair after rejects) 3.25 3.44 3.79 0.00 Supervisory Compensation ($ / supervisor / year) 26,276 26,426 27,064 Branded Superior Materials Usage 30% 55% 70% 0% Production TQM/6-Sigma Spending - Current ($/pair produced) 0.00 2.59 4.80 0.00 Cumulative ($000s) 3,250 22,889 48,348 0 Total Production Cost ($ per pair produced) 18.36 26.36 40.29 0.00 Reject Rate 0.8% 4.6% 13.3% 0.0% Cost Per S/Q Star (total production cost per pair : S/Q rating) 1.84 3.63 6.38 0.00Industry 2 PERFORMANCE BENCHMARKS Year 16 (concluded) Branded Operating Benchmarks Industry 2 Company North America Low Average High F Distribution and Warehouse Costs ($ per pair available for sale) 2.16 4.33 5.82 5.82 Cost of Branded Pairs Sold (production, freight, x-rate cost adjustment) 23.66 32.25 38.39 26.69 Internet Segment Marketing Expenses ($ per pair sold) 16.77 34.62 46.54 16.77 Operating Profit ($ per pair sold) 9.71 16.57 34.70 23.20 Operating Profit Margin 8.8% 16.7% 32.1% 28.3% Wholesale Segment Marketing Expenses ($ per pair sold) 7.74 14.98 19.28 7.74 Operating Profit ($ per pair sold) 4.36 11.16 19.76 8.32 Operating Profit Margin 7.0% 16.8% 28.5% 17.0% Industry 2 Company Europe-Africa Low Average High F Distribution and Warehouse Costs ($ per pair available for sale) 2.57 8.12 14.01 11.95 Cost of Branded Pairs Sold (production, freight, x-rate cost adjustment) 23.48 32.92 39.33 31.55 Internet Segment Marketing Expenses ($ per pair sold) 14.86 31.62 42.86 14.86 Operating Profit ($ per pair sold) 10.26 20.79 41.01 20.11 Operating Profit Margin 11.6% 20.2% 36.4% 24.6% Wholesale Segment Marketing Expenses ($ per pair sold) 7.41 14.10 20.20 7.41 Operating Profit ($ per pair sold) 4.41 12.68 23.08 4.41 Operating Profit Margin 8.9% 18.5% 32.2% 8.9% Industry 2 Company Asia-Pacific Low Average High F Distribution and Warehouse Costs ($ per pair available for sale) 1.96 5.35 3.72 5.32 Cost of Branded Pairs Sold (production, freight, x-rate cost adjustment) 18.58 27.91 35.54 21.23 Internet Segment Marketing Expenses ($ per pair sold) 18.41 35.31 48.87 18.41 Operating Profit ($ per pair sold) 9.13 20.21 35.68 27.27 Operating Profit Margin 8.2% 20.5% 35.6% 33.1% Wholesale Segment Marketing Expenses ($ per pair sold) 6.82 15.32 17.61 6.82 Operating Profit ($ per pair sold) 8.33 14.95 21.82 15.09 Operating Profit Margin 11.9% 23.1% 31.8% 30.4% Industry 2 Company I atin AmarinaLaull AllIGIIva Low Average High F Distribution and Warehouse Costs ($ per pair available for sale) 5.21 11.83 18.69 18.24 Cost of Branded Pairs Sold (production, freight, x-rate cost adjustment) 20.54 33.02 44.44 33.57 Internet Segment Marketing Expenses ($ per pair sold) 13.25 28.91 38.82 13.25 Operating Profit ($ per pair sold) 10.81 19.93 35.00 17.89 Operating Profit Margin 11.5% 20.3% 33.3% 22.3% Wholesale Segment Marketing Expenses ($ per pair sold) 5.75 12.17 19.14 5.75 Operating Profit ($ per pair sold) 0.13 12.12 22.86 0.13 Operating Profit Margin 0.3% 18.2% 34.5% 0.3% Private-Label Operating Benchmarks Industry 2 Company Low Average High F North America Cost Per Pair Sold (production, freight, tariffs, x-rates) 24.59 28.47 33.51 30.75 Margin Over Direct Cost ($ per pair sold) -2.51 +4.44 +11.41 +0.75 Cost Per Pair Sold (production, freight, tariffs, x-rates) 21.32 32.92 0.00 Europe-Africa 25.52 Margin Over Direct Cost ($ per pair sold) +11.63 +14.48 +19.70 0.00 Asia-Pacific Cost Per Pair Sold (production, freight, tariffs, x-rates) 18.28 21.49 24.45 23.16 Margin Over Direct Cost ($ per pair sold) +6.98 +15.12 +23.34 +7.77 Cost Per Pair Sold (production, freight, tariffs, x-rates) 18.64 25.67 38.06 0.00 Latin America Margin Over Direct Cost ($ per pair sold) +3.27 +11.58 +17.95 0.00Industry 2 COMPARATIVE COMPETITIVE EFFORTS Year 16 Co. F vs North America Competitive Efforts by Company Industry Ind. A B C D E F G H I J Average Avg. INTERNET SEGMENT Retail Price ($ per unit) 95.50 80.00 80.34 91.00 90.00 69.50 88.00 91.00 98.00 89.99 87.33 -20.4% 20,000 19,500 16,000 15,250 16,500 5,250 15,000 14,000 11,750 20,000 15,325 Search Engine Advertising ($000s) -65.7% Free Shipping No No No No No No No No No No None Near Avg S/Q Rating (1 to 10 stars) 10.0* 8.0* 6.4* 8.0 5.5* 4.5* 6.1* 7.8* 7.2* 10.0* 7.4* 39.2 % Model Availability 50 483 499 490 470 495 494 490 493 498 446 +11.0% Brand Advertising ($000s) 30,000 30,000 29,000 28,500 29,000 9,000 28,500 28,500 30,000 30,000 27,250 -67.0% Celebrity Appeal 445 75 210 0 90 80 0 0 210 111 -27.9% Brand Reputation (prior-year image) 100 83 91 79 60 69 77 83 71 100 81 -14.8% Online Orders (000s of pairs) 894 1,055 1,088 583 627 594 568 551 420 1,170 755 -21.3% Pairs Sold ($000s of pairs) 894 1,055 1,088 583 627 594 568 551 420 1,170 755 -21.3% Market Share (%) 11.8 % 14.0 % 14.4% 7.7% 8.3% 7.9% 7.5% 7.3% 5.6% 15.5% 10.0% -2.1 pts. WHOLESALE SEGMENT olesale Price ($ per pair) 67.00 70.00 80.00 66.00 62.00 49.00 63.00 65.00 70.00 64.32 65.63 -25.3 % S/Q Rating (1 to 10 stars) 10.0* 8.0* 6.4* 8.0* 5.5* 4.5* 6.1* 7.8* 7.2* 10.0* 7.4* -39.2% Model Availability 50 483 499 190 470 495 494 190 493 498 446 +11.0% Brand Advertising ($000s) 30,000 30,000 29,000 28,500 29,000 9,000 28,500 28,500 3.500 30,000 30,000 27,250 -67.0% Rebate Offer ($ per pair) 5.00 5.00 5.00 5.00 5.00 4.00 5.00 4.00 5.00 4.00 4.70 -14.9% Delivery Time (weeks) 2 wks 2 wks 1 wks 2 wks 2 wks 2 wks 2 wks 2 wks 1 wks 3 wks 1.9 wks +5.3% Retailer Support ($ per outlet) 6,500 1,000 750 3,500 4.000 4,000 4,000 4.000 2.000 5.750 3,550 +12.7% Retailer Outlets 2,576 731 528 1,540 1,032 871 1,552 1,282 789 4,469 1,537 -43.3 % Celebrity Appeal 445 75 210 90 80 0 210 111 -27.9% 100 83 91 79 60 69 77 83 71 100 81 -14.8% Brand Reputation (prior-year image) Pairs Demanded (000s of pairs) 3,772 2,062 1,736 2,243 2,286 3,045 2,315 2,147 1,835 5,150 2,659 +14.5% Gained / Lost (due to stockouts) +96 +52 +44 +57 +58 -599 +59 +55 +47 +131 Pairs Sold (000s of pairs) 3,868 2,114 1,780 2,300 2,344 2,446 2,374 2,202 1,882 5,281 2,659 -8.0% Market Share (%) 14.5 % 8.0% 6.7% 8.6% 8.8% 9.2 % 8.9% 8.3% 7.1% 19.9% 10.0% -0.8 pts. PRIVATE-LABEL SEGMENT Total Offer Price (maximum = $55.63) 34.99 0.00 70.00 44.00 32.00 32.50 0.00 32.99 55.00 37.00 Private-Label S/Q Rating (minimum = 5.0 stars) 5.0* 0.0* 5.7* 5.2* 5.5* 5.0* 0.0* 6.2* 5.8* 5.0* Pairs (000s Pairs Offered / Available (000s) 1,182 0 1,675 387 634 823 0 1,431 443 1,886 Demand = 3,660 Pairs Sold (000s) 732 0 0 634 732 0 732 0 732 Offered = 8,461 Market Share (%) 20.0% 0.0% 0.0 % 0.0% 17.3% 20.0% 0.0 % 20.0% 0.0 % 20.0% Sold = 3,562 Note: A market share limitation of 20.0% was imposed by chain retailers to help reduce market domination by a few private-label suppliers and promote competition among more suppliers. INTERNET SEGMENT - NORTH AMERICA WHOLESALE SEGMENT - NORTH AMERICAIndustry 2 REGIONAL AVERAGE COMPETITIVE EFFORTS Nrth America Year10 Year11 Year12 Year13 Year14 Year15 Year 16 1 INTERNET SEGMENT Retail Price i$ per unit) 67.00 81.35 88.07 87.90 87.85 86.34 87.33 Search Engine Advertising ($0005) 5,000 5,225 7,475 9,200 10,350 12,875 15,325 Free Shipping No No Yes Yes No No No S/Q Rating (1 to meters) 4.01% 6.61% 7.31% 7.41% 7.61% 7.61% 7.41% Model Availability 200 298 369 396 411 428 446 Brand Advertising ($0003) 10,000 12,600 17,000 17,750 22,450 25,400 27,250 Celebrity Appeal 0 0 57 111 105 105 111 Brand Reputation (prior-year image) 70 70 78 80 80 81 81 Online Orders (0005 of pairs) 353 405 473 537 614 705 755 Pairs Sold ($0003 of pairs) 353 405 473 537 514 705 755 Market Share (%) 10.0% 10.0% 10.0% 10.0% 10.0% 10.0% 10.0% WHOLESALE SEGMENT Wholesale Price ($ per pair} 48.00 56.07 61.99 63.52 63.72 64.43 65.63 S/Q Rating (1 to 10 stars} 4.01% 6.61% 7.31% 7.41% 7.61% 7.61% 7.41% Model Availability 200 298 369 396 411 428 446 Brand Advertising ($0003) 10,000 12,600 17,000 17,750 22,450 25,400 27,250 Rebate Offer (3': per pair} 5.00 4.30 4.90 4.80 4.50 4.80 4.70 Delivery Time (weeks) 3 wks 3 wks 2 wks 2 wks 2 wks 2 wks 2 wks Retailer Support ($ per outlet) 4,000 4,500 4,175 3,975 3,750 3,550 3,550 Retailer Outlets 1,000 1,000 1,512 1,501 1,534 1,635 1,537 Celebrity Appeal 0 0 57 111 105 105 111 Brand Reputation (prior-yearimage) 70 70 78 80 80 81 81 Pairs Demanded (0005 of pairs) 1,997 2,129 2,245 2,315 2,472 2,607 2,659 Gained I L081: (due to stockouts) 0 0 0 0 0 0 0 Pairs Sold (0003 of pairs) 1,997 2,129 2,245 2,315 2,472 2,607 2,659 Market Share (%) 10.0 % 10.0 % 10.0 % 10.0 % 10.0 % 10.0 % 10.0 % Industry 2 TIME SERIES COMPETITIVE EFFORTS COMPANY F North America Company F Competitive Efforts Year 10 Year 11 Year 12 Year 13 Year 14 Year 15 Year 16 Year 17 INTERNET SEGMENT Retail Price ($ per unit) 67.00 70.50 70.00 70.00 69.50 69.50 69.50 Search Eng'neAdverhsW 'ng ($0005) 5,000 6,000 5,000 5,000 5,000 5,250 5,250 Free Shipping No No No No No No No 810 Rating (1 to 10 stars) 4.0* 4.6* 4.0* 4.0* 4.5* 4.5* 4.5* Model Availability 200 299 398 448 450 450 495 Brand Advertising ($0005) 10,000 12,000 9,000 9,000 9,000 9,000 9,000 Celebrity Appeal 0 0 70 70 0 80 80 Brand Reputation (prior-year image) 70 70 64 60 63 68 69 Online Orders (0005 of pairs) 353 466 460 459 410 480 594 Pairs Sold ($000s of pairs) 353 466 460 459 410 480 594 Market Share (96) 10.0 % 11.5 % 9.7 % 8.6 % 6.7 % 6.8 % 7.9 % WHOLESALE SEGMENT Wholesale Price (5 per pair) 48.00 50.50 50.00 50.00 49.00 49.00 49.00 SIG Rating (1 to 10 stars) 4.0* 4.6* 4.0* 4.0* 4.5* 4.5* 4.5'k Model Availability 200 299 398 448 450 450 495 Brand Advertising ($000s) 10,000 12,000 9,000 9,000 9,000 9,000 9,000 Rebate Offer ($ per pair) 5.00 4.00 3.00 3.00 3.00 4.00 4.00 Delivery Time (weeks) 3 wks 2 wks 2 wks 2 wks 2 wks 2 wks 2 wks Retailer Support ($ per outlet) 4,000 4,000 4,000 4,000 4,000 4,000 4,000 Retailer Outlets 1 ,000 1,000 1,051 902 817 821 871 Celebrity Appeal 0 0 70 70 0 80 80 Brand Reputation (prior-year image) 70 70 64 60 63 68 69 Pairs Demanded (000s of pairs) 1,997 2,340 2,313 2,300 2,255 2,667 3,045 Gained I Lost {due to stockouts) 0 +2 j A 0 -20 Pairs Sold (000s of pairs) 1,997 2,342 2,035 2,056 2,255 2,647 2,446 Market Share (96) 10.0 % 11.0 % 9.1 % 8.9 % 9.1 % 10.2 % 9.2 % PRIVATE-LABEL SEGMENT Otter Price (maximum = $55.03) 32.00 32.00 35.00 34.00 31.00 32.50 32.50 5/0 Rating (minimum = 5.0 stars) 3.0* 3.1* 5.0* 5.0* 5.0* 5.0* 5.0* Pairs Offered / Available (0005) 200 200 458 458 605 672 823 Pairs Sold (000s) 200 0 146 458 605 672 732 Market Share (94,) 10.0 % 0.0 % 5.9 % 16.8 % 20.0 % 20.0 % 20.0 % Funky Footwear PERFORMANCE HIGHLIGHTS Industry 2) Financial Year 10 Year 11 Year 12 Year 13 Year 14 Year 15 Year 16 Year 17 Year 18 EPS (earnings per share) $2.00 $2.68 $1.55 $3.20 $3.41 $3.99 $3.93 ROE (return on equity) 20.0% 22.6% 11.1% 19.3% 17.2% 17.1 % 14.4% Stock Price $30.00 $34.59 $13.99 $38.61 $48.89 $51.46 $37.80 Credit Rating B A B At A+ A+ A+ Image Rating 70 64 60 63 68 69 66 Net Internet 90,315 114,642 128,422 148,752 144,269 159,066 170,553 Revenues Wholesale 314,731 362,118 342,346 365,848 379,788 425,965 413,680 ($000s) Private-Label 27,600 7,400 12,545 30,072 37,549 43,771 49,777 Total 432,646 484, 160 483,313 544,672 561,606 628,802 634,010 Branded Production Year 10 Year 11 Year 12 Year 13 Year 14 Year 15 Year 16 Year 17 Year 18 N.A. - Productivity (pairs/worker/year) 5,000 4,869 4,612 4,556 4,718 4,538 4,554 Labor Cost ($ per pair produced) 8.98 9.72 8.48 8.76 8.54 9.05 9.13 Production Cost ($/pair prod.) 23.98 26.00 27.18 26.11 24.93 25.75 25.69 E-A - Productivity (pairs/worker/year Labor Cost ($ per pair produced) 0.00 0.00 0.00 0.00 0.00 0.00 0.00 Production Cost ($/pair prod.) 0.00 0.00 0.00 0.00 0.00 0.00 0.00 A-P - Productivity (pairs/worker/year 3,500 3,456 3,193 3,214 3.464 3.399 3,501 Labor Cost ($ per pair produced) 4.89 5.14 4.60 4.32 3.86 3.98 3.90 Production Cost ($/pair prod.) 21.15 22.42 22.77 21.36 20.46 20.85 20.14 L.A. - Productivity (pairs/worker/year) 0 0 0 Labor Cost ($ per pair produced) 0.00 0.00 0.00 0.00 0.00 0.00 0.00 Production Cost ($/pair prod.) 0.00 0.00 0.00 0.00 0.00 0.00 0.00 Branded Operations Year 10 Year 11 Year 12 Year 13 Year 14 Year 15 Year 16 Year 17 Year 18 N.A. - S/Q Rating (of pairs sold in region) 4.0* 4.6* 4.0* 4.0* 4.5* 4.5* 4.5* Internet - Pairs Sold (000s) 353 466 460 459 410 480 594 Market Share (%) 10.0% 11.5% 9.7% 8.6% 6.7% 6.8% 7.9% Operating Profit 17.88 20.73 19.67 20.14 19.91 20.87 23.20 Whale - Pairs Sold (000s) 1,997 2,342 2,035 2,056 2,255 2.647 2,446 Market Share (%) 10.0% 11.0% 9.1% 8.9% 9.1% 10.2% 9.2% Operating Profit 8.80 9.49 7.26 8.51 10.00 8.87 8.32 E-A - S/Q Rating (of pairs sold in region) 4.0* 4.4* 3.9* 3.9* 4.5* 4.5* 4.5* Internet - Pairs Sold (000s) 300 391 480 543 527 569 613 Market Share (of in n of 11 7 of 12 n of 12 n of 10 3 of a 7 0/Operating Profit 15.15 17.81 12.94 18.35 17.10 21.60 20.11 Whale - Pairs Sold (000s) 1,700 2,064 1,916 2,096 2,303 2,449 2,453 Market Share (%) 10.0% 11.1% 9.8% 10.3% 10.8% 10.9% 10.8% Operating Profit 7.04 7.66 -0.68 3.73 3.77 6.09 4.41 A-P - S/Q Rating (of pairs sold in region) 4.0* 4.0* 3.7* 3.7* 4.5* 4.5* 4.5* Internet - Pairs Sold (000s) 225 255 301 365 380 374 348 Market Share (%) 10.0% 9.4% 9.3% 9.9% 8.6% 7.0% 5.7% Operating Profit 13.92 20.65 22.18 25.56 25.94 26.93 27.27 Whale - Pairs Sold (000s) 1,275 1,249 1,543 1,601 1,795 2,031 1,992 Market Share (%) 10.0% 8.7% 9.9% 9.6% 9.9% 10.2% 9.4% Operating Profit 10.51 11.63 11.78 13.32 13.73 14.06 15.09 L.A. - S/Q Rating (of pairs sold in region) 4.0* 4.0* 3.7* 3.7* 4.5* 4.5* 4.5* Internet - Pairs Sold (000s) 225 243 341 415 469 504 536 Market Share (%) 10.0% 9.1% 10.8% 11.3% 10.8% 9.7% 9.0% Operating Profit 8.25 14.10 10.75 24.94 21.33 20.59 17.89 Whale - Pairs Sold (000s) 1,275 1,261 1,476 1,478 1,555 1,517 1,589 Market Share (%) 10.0% 8.8% 9.6% 8.8% 8.6% 7.6% 7.4% Operating Profit 4.84 5.98 -0.09 9.74 4.10 2.46 0.13 P-Label Operations Year 10 Year 11 Year 12 Year 13 Year 14 Year 15 Year 16 N.A. - Pairs Sold (000s) 200 0 146 458 605 672 732 Margin Over Direct Cost +3.07 0.00 -7.83 -1.18 -0.07 -0.17 +0.75 E-A - Pairs Sold (000s) 200 200 0 0 0 0 0 Margin Over Direct Cost +1.07 -2.17 0.00 0.00 0.00 0.00 0.00 A-P - Pairs Sold (000s) 200 0 235 475 649 733 814 Margin Over Direct Cost +6.86 0.00 -3.92 +1.10 +3.97 +4.74 +7.77 L.A. - Pairs Sold (000s) 200 0 0 0 0 0 0 Margin Over Direct Cost +0.86 0.00 0.00 0.00 0.00 0.00 0.00Funky Footwear PRODUCTION AND WORKFORCE Year 16 (Industry 2) PRODUCTION STATISTICS North America Europe-Africa Asia-Pacific Latin America Total all facilities) Branded P-Label Branded P-Label Branded P-Label Branded P-Label Branded P-Label Footwear Regular-Time Pairs 6,000 0 0 6,000 0 12,000 0 Production Overtime Pairs 805 0 0 855 0 1,660 (000s of pairs) Rejected Pairs -840 -73 -0 -402 -41 -0 -1,242 -114 Net Footwear Production 5, 160 732 0 0 5.598 814 0 0 10,758 1,546 S/Q Rating of Pairs Produced 4.5* 5.0* 0.0* 0.0* 4.5* 5.0* 0.0* 0.0* Number of Models Produced 500 100 0 0 450 100 0 0 Branded P-Label Branded P-Label Branded P-Label Branded P-Label Branded P-Label Reject Rate (% of regular + overtime pairs) 14.0% 9.1% 0.0% 0.0% 6.7% 4.8% 0.0% 0.0% 10.4% 6.9% Cost of Rejected Pairs -$ Thousands 18,576 1,976 0 7,557 863 0 26,133 2,839 $ Per Pair 3.60 2.70 0.00 0.00 1.35 1.06 0.00 0.00 2.37 1.77 Production Capability (000s of pairs without OT) 6,000 pairs 0 pairs 6,000 pairs 0 pairs 12,000 pairs Total Production (including rejected pairs) 6,805 pairs 0 pairs 6,855 pairs 0 pairs 13,660 pairs Utilization of Production Capability (max = 120%) 113% 0% 114% 0% 114% North America Total WORKFORCE STATISTICS Europe-Africa Asia-Pacific Latin America (all facilities) Annual Total Annual Total Annual Total Annual Total Total $ per Cost $ per Cost $ per Cost $ per Cost Cost Worker ($000s) Worker ($000s) Worker ($000s) Worker ($000s) ($000s) Workforce Base Wages 35,734 47,097 12,737 21,831 0 68,928 C Compensation Incentive Pay 0 0 O 0 (in Year 16) Fringe Benefits O 0 0 Total Regular Comp. 35,734 47,097 12,737 21,831 68,928 lo ol Overtime Pay 7, 189 9,475 2,722 4,666 14, 141 oo oo oo Total Compensation 42,923 56,572 15,459 26,497 83,069 Best Practices Training Expenditures (in Y16) 600 791 o o ol oo 600 1,028 1,819 Supervisory Compensation (salary + benefits) 63,060 2,081 26,276 1,130 3,211 Incentive Pay as % of Regular Compensation 0.0% 0.0% 0.0% 0.0% Cumulative Best Practices (total $ per worker) 4,600 0 4,200 0Funky Footwear MARKETING AND ADMINISTRATIVE EXPENSES Year 16 (Industry 2) MARKETING EXPENSES North America Europe-Africa Asia-Pacific Latin America Total $000s $/Pair $000s $/Pair $000s $/Pair $000s $/Pair $000s $/Pair Internet Search Engine Advertising 5,250 8.84 4,500 7.34 3,000 8.62 3,000 5.60 15,750 7.53 Segments Website Maintenance 2,330 3.92 2,268 3.70 2,150 6.18 2,150 4.01 8,898 4.26 Brand Advertising (Note 1) 1,759 2.96 1,699 2.77 892 2.56 1,387 2.59 5,737 2.74 Celebrity Endorsements (Note 2) 624 1.05 644 1.05 366 1.05 563 1.05 2, 197 1.05 Total Internet Marketing 9,963 16.77 9, 111 14.86 6,408 18.41 7,100 13.25 32,582 15.58 $000s $/Pair $000s $/Pair $000s $/Pair $000s $/Pair $000s $/Pair Wholesale - Brand Advertising (Note 1) 7,241 2.96 6,801 2.77 5, 108 2.56 4,113 2.59 23,263 2.74 Segments Rebate Redemption 1,957 0.80 1, 104 0.45 1,594 0.80 715 0.45 5,370 0.63 On-Time Delivery 3,669 1.50 3,680 1.50 2,988 1.50 1, 192 0.75 11,529 1.36 Retailer Support 3,484 1.42 4,024 1.64 1,812 0.91 1,455 0.92 10,775 1.27 Celebrity Endorsements (Note 2) 2,569 1.05 2,577 1.05 2,093 1.05 1,669 1.05 8,908 1.05 Total Wholesale Marketing 18,920 7.74 18, 186 7.41 13,595 6.82 9,144 5.75 59,845 7.06 Note 1: Brand advertising expenditures in each region are allocated to the internet and wholesale segments based on each segment's percentage of total branded pairs sold in the region. Note 2: Expenditures for celebrity endorsements are allocated to the internet and wholesale segments based on each segment's percentage of total branded pairs sold in the region. ADMINISTRATIVE EXPENSES North America Europe-Africa Asia-Pacific Latin America Total $000s $/Pair $000s $/Pair $000s $/Pair $000s $/Pair $000s $/Pair Executive Salaries (Note 1) 1,717 0.56 1,731 0.56 1,322 0.56 1,200 0.56 5,970 0.56 Corporate Overhead (Note 2) 4,314 1.42 4,350 1.42 3,321 1.42 3,015 1.42 15,000 1.42 CSRC Ethics Training / Enforcement 115 0.04 116 0.04 89 0.04 80 0.04 400 0.04 Initiatives Cafeteria / On-Site Child Care 173 0.06 174 0.06 133 0.06 121 0.06 600 0.06 Ventilation / Lighting / Safety 144 0.05 145 0.05 111 0.05 101 0.05 500 0.05 Supplier Code of Conduct 647 0.21 653 0.21 498 0.21 452 0.21 2,250 0.21 Fixed Costs of Idled Prodcution Facility (Note 3) 362 0.12 365 0.12 278 0.12 253 0.12 1,257 0.00 Total Administrative Expenses (Note 4) 7,472 2.46 7,534 2.46 5,752 2.46 5,222 2.46 25,977 2.46
Step by Step Solution
There are 3 Steps involved in it

Get step-by-step solutions from verified subject matter experts