

Question: Looo PRACTICE 2 (3 POINTS) In industry analysis, a wide variety of factors are considered so as to understand their impacts on firm profitability. Your
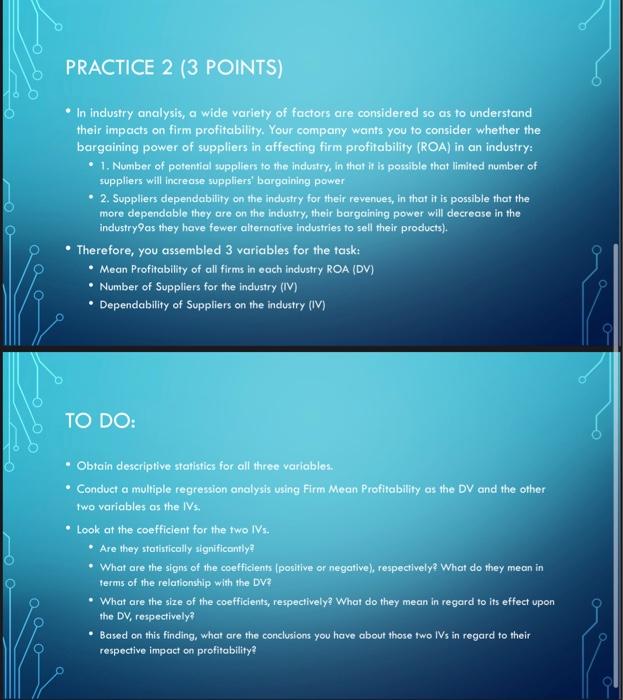
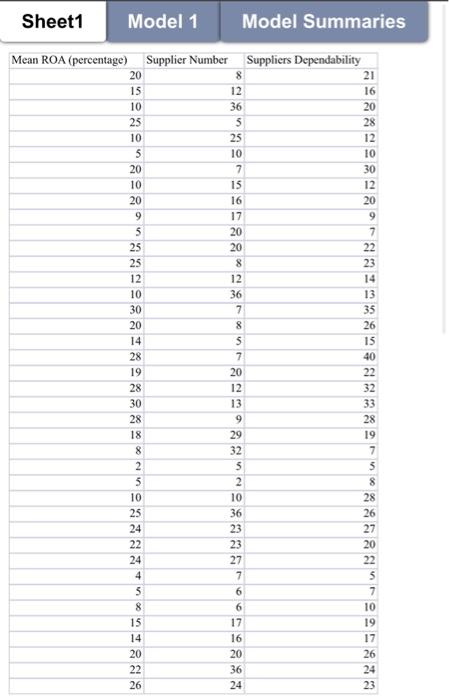
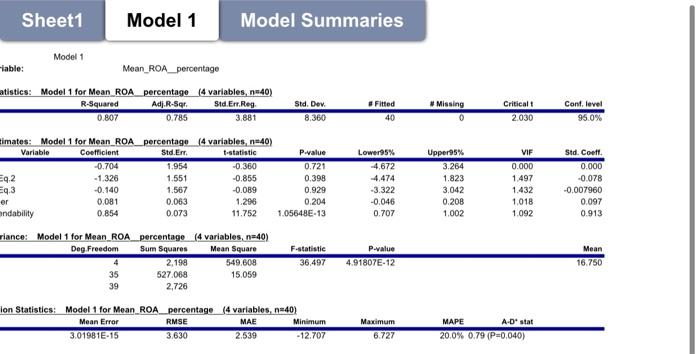
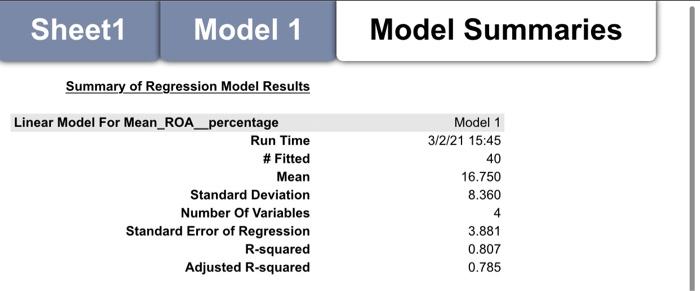
Looo PRACTICE 2 (3 POINTS) In industry analysis, a wide variety of factors are considered so as to understand their impacts on firm profitability. Your company wants you to consider whether the bargaining power of suppliers in affecting firm profitability (ROA) in an industry: 1. Number of potential suppliers to the inclustry, in that it is possible that limited number of suppliers will increase suppliers' bargaining power 2. Suppliers dependability on the industry for their revenues, in that it is possible that the more dependable they are on the industry, their bargaining power will decrease in the industry as they have fewer alternative industries to sell their products). Therefore, you assembled 3 variables for the task: Mean Profitability of all firms in each industry ROA (DV) Number of Suppliers for the industry (IV) Dependability of Suppliers on the industry (IV) TO DO: - Obtain descriptive statistics for all three variables. Conduct a multiple regression analysis using Firm Mean Profitability as the DV and the other two variables as the IVs. Look at the coefficient for the two IVs. Are they statistically significantly What are the signs of the coefficients (positive or negative), respectively? What do they meen in terms of the relationship with the DV? What are the size of the coefficients, respectively? What do they mean in regard to its effect upon the DV, respectively . Based on this finding, what are the conclusions you have about those two IVs in regard to their respective impact on profitability? Sheet1 Model 1 Model Summaries Mean ROA (percentage) Supplier Number Suppliers Dependability 21 16 8 12 36 5 25 10 7 15 16 17 20 20 12 36 20 15 10 25 10 5 20 10 20 9 5 25 25 12 10 30 20 14 28 19 28 30 28 18 8 2 5 10 25 24 22 24 4 5 8 15 14 20 22 26 SUOM%B8%votu 20 28 12 10 30 12 20 9 7 22 23 14 13 35 26 15 40 22 32 33 28 19 7 5 8 28 26 27 20 22 5 7 10 19 17 26 24 23 JOS SEUS 7 20 12 13 9 29 32 2 10 36 23 23 27 7 6 6 17 16 20 36 24 & SIMONS Sheet1 Model 1 Model Summaries Model 1 -iable: Mean_ROA percentage atistics: Model 1 for Mean_ROA_percentage (4 variables, n=40) R-Squared Adj.R-Sqr. Std.Emr. Reg 0.807 0.785 3,881 Fitted Std. Dev. 8.360 #Missing 0 Critical 2.030 Cont. level 95.0% 40 imates: Model 1 for Mean ROA_percentage (4 variables, n=40) Variable Coefficient Std EI, t-statistic -0.704 1.954 -0.360 E9.2 -1.326 1.551 -0.855 Eq.3 -0.140 1.567 -0.089 er 0.081 0.063 1.296 ndability 0.854 0.073 11.752 P-value 0.721 0.398 0.929 0.204 1.05648E-13 Lower95% -4,672 -4,474 -3.322 -0.046 0.707 Upper95% 3.264 1.823 3.042 0.208 1.002 VIF 0.000 1.497 1.432 1,018 1.092 Std. Coeft 0.000 -0.078 -0.007960 0.097 0.913 viance: Model 1 for Mean ROA_percentage 14 variables, n=40) Deg Freedom Sum Squares Mean Square 2.198 549.608 35 527.068 15.059 39 2,726 F-statistic 36.497 P-value 4.91807E-12 Mean 16.750 lon Statistics: Model 1 for Mean ROA_percentage (4 variables, n=40) Mean Error RMSE MAE Minimum 3.01981E-15 3.630 2.539 -12.707 MAPE A D' stat Maximum 6.727 20.0% 0.79 (P=0,040) Sheet1 Model 1 Model Summaries Summary of Regression Model Results Linear Model For Mean_ROA_percentage Run Time # Fitted Mean Standard Deviation Number Of Variables Standard Error of Regression R-squared Adjusted R-squared Model 1 3/2/21 15:45 40 16.750 8.360 4 3.881 0.807 0.785 Looo PRACTICE 2 (3 POINTS) In industry analysis, a wide variety of factors are considered so as to understand their impacts on firm profitability. Your company wants you to consider whether the bargaining power of suppliers in affecting firm profitability (ROA) in an industry: 1. Number of potential suppliers to the inclustry, in that it is possible that limited number of suppliers will increase suppliers' bargaining power 2. Suppliers dependability on the industry for their revenues, in that it is possible that the more dependable they are on the industry, their bargaining power will decrease in the industry as they have fewer alternative industries to sell their products). Therefore, you assembled 3 variables for the task: Mean Profitability of all firms in each industry ROA (DV) Number of Suppliers for the industry (IV) Dependability of Suppliers on the industry (IV) TO DO: - Obtain descriptive statistics for all three variables. Conduct a multiple regression analysis using Firm Mean Profitability as the DV and the other two variables as the IVs. Look at the coefficient for the two IVs. Are they statistically significantly What are the signs of the coefficients (positive or negative), respectively? What do they meen in terms of the relationship with the DV? What are the size of the coefficients, respectively? What do they mean in regard to its effect upon the DV, respectively . Based on this finding, what are the conclusions you have about those two IVs in regard to their respective impact on profitability? Sheet1 Model 1 Model Summaries Mean ROA (percentage) Supplier Number Suppliers Dependability 21 16 8 12 36 5 25 10 7 15 16 17 20 20 12 36 20 15 10 25 10 5 20 10 20 9 5 25 25 12 10 30 20 14 28 19 28 30 28 18 8 2 5 10 25 24 22 24 4 5 8 15 14 20 22 26 SUOM%B8%votu 20 28 12 10 30 12 20 9 7 22 23 14 13 35 26 15 40 22 32 33 28 19 7 5 8 28 26 27 20 22 5 7 10 19 17 26 24 23 JOS SEUS 7 20 12 13 9 29 32 2 10 36 23 23 27 7 6 6 17 16 20 36 24 & SIMONS Sheet1 Model 1 Model Summaries Model 1 -iable: Mean_ROA percentage atistics: Model 1 for Mean_ROA_percentage (4 variables, n=40) R-Squared Adj.R-Sqr. Std.Emr. Reg 0.807 0.785 3,881 Fitted Std. Dev. 8.360 #Missing 0 Critical 2.030 Cont. level 95.0% 40 imates: Model 1 for Mean ROA_percentage (4 variables, n=40) Variable Coefficient Std EI, t-statistic -0.704 1.954 -0.360 E9.2 -1.326 1.551 -0.855 Eq.3 -0.140 1.567 -0.089 er 0.081 0.063 1.296 ndability 0.854 0.073 11.752 P-value 0.721 0.398 0.929 0.204 1.05648E-13 Lower95% -4,672 -4,474 -3.322 -0.046 0.707 Upper95% 3.264 1.823 3.042 0.208 1.002 VIF 0.000 1.497 1.432 1,018 1.092 Std. Coeft 0.000 -0.078 -0.007960 0.097 0.913 viance: Model 1 for Mean ROA_percentage 14 variables, n=40) Deg Freedom Sum Squares Mean Square 2.198 549.608 35 527.068 15.059 39 2,726 F-statistic 36.497 P-value 4.91807E-12 Mean 16.750 lon Statistics: Model 1 for Mean ROA_percentage (4 variables, n=40) Mean Error RMSE MAE Minimum 3.01981E-15 3.630 2.539 -12.707 MAPE A D' stat Maximum 6.727 20.0% 0.79 (P=0,040) Sheet1 Model 1 Model Summaries Summary of Regression Model Results Linear Model For Mean_ROA_percentage Run Time # Fitted Mean Standard Deviation Number Of Variables Standard Error of Regression R-squared Adjusted R-squared Model 1 3/2/21 15:45 40 16.750 8.360 4 3.881 0.807 0.785
Step by Step Solution
There are 3 Steps involved in it

Get step-by-step solutions from verified subject matter experts