

Question: Lower 95% Mean Upper 95% Mean Predicted Demand Demand Demand 31 8. 497192069 8. 142077263 8. 852306876 StdErr Indiv Lower 95% Indiv Upper 95% Mean
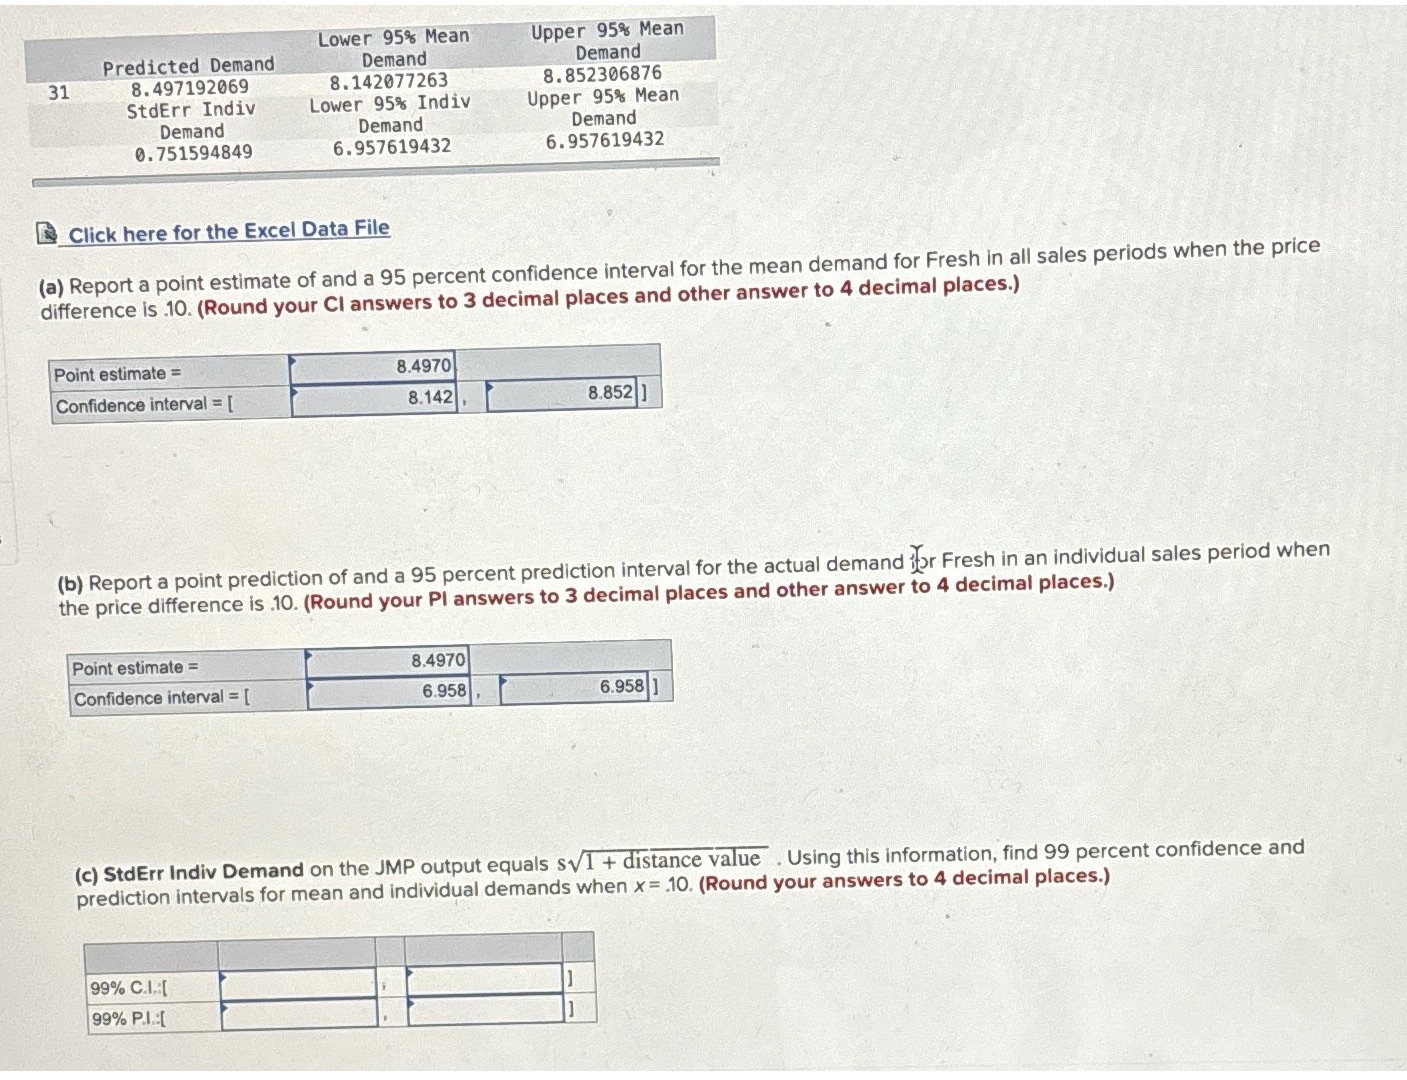

Lower 95% Mean Upper 95% Mean Predicted Demand Demand Demand 31 8. 497192069 8. 142077263 8. 852306876 StdErr Indiv Lower 95% Indiv Upper 95% Mean Demand Demand Demand 0. 751594849 6.957619432 6. 957619432 Click here for the Excel Data File (a) Report a point estimate of and a 95 percent confidence interval for the mean demand for Fresh in all sales periods when the price difference is .10. (Round your CI answers to 3 decimal places and other answer to 4 decimal places.) Point estimate = 8.4970 Confidence interval = [ 8.142 8.852 (b) Report a point prediction of and a 95 percent prediction interval for the actual demand for Fresh in an individual sales period when the price difference is .10. (Round your PI answers to 3 decimal places and other answer to 4 decimal places.) Point estimate = 8.4970 Confidence interval = [ 6.958 6.958 (c) StdErr Indiv Demand on the JMP output equals sv1 + distance value . Using this information, find 99 percent confidence and prediction intervals for mean and individual demands when x = .10. (Round your answers to 4 decimal places.) 99% C.I.:[ 99% P.I.:[
Step by Step Solution
There are 3 Steps involved in it

Get step-by-step solutions from verified subject matter experts