Question: Lower Control Limit (LCL Subscript x overbarLCLx) = ___ Based on the x overbarx-chart, the wire cutting process has been IN CONTROL or OUT OF

Lower Control Limit (LCL Subscript x overbarLCLx)

Lower Control Limit (LCL Subscript x overbarLCLx) = ___

Based on the x overbarx-chart, the wire cutting process has been IN CONTROL or OUT OF CONTROL?

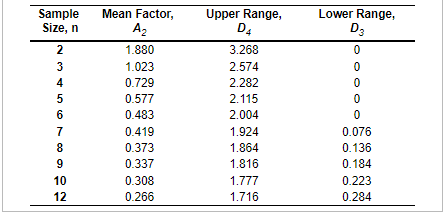
The control limits for the 3-sigma R-chart are (round all intermediate calculations to three decimal places before proceeding with further calculations): Upper Control Limit (UCL Subscript Upper RUCLR) = ___

Lower Control Limit (LCL Subscript Upper RLCLR) = ___

Based on the R-chart, the wire cutting process has been IN CONTROL or OUT OF CONTROL ?

Lower Control Limit (LCL Subscript x overbarLCLx)

Refer to Table S6.1 - Factors for Computing Control Chart Limits ( 3 sigma) for this problem. Sampling 4 pieces of precision-cut wire (to be used in computer assembly) every hour for the past 24 hours has produced the following results: Based on the sampling done, the control limits for 3-sigma x chart are (round all intermediate calculations to three decimal places before proceeding with further calculations): Upper Control Limit (UCL)= inches (round your response to three decimal places). \begin{tabular}{cccc} \hline Sample Size, n & Mean Factor, A2 & Upper Range, D4 & Lower Range, D3 \\ \hline 2 & 1.880 & 3.268 & 0 \\ 3 & 1.023 & 2.574 & 0 \\ 4 & 0.729 & 2.282 & 0 \\ 5 & 0.577 & 2.115 & 0 \\ 6 & 0.483 & 2.004 & 0 \\ 7 & 0.419 & 1.924 & 0.076 \\ 8 & 0.373 & 1.864 & 0.136 \\ 9 & 0.337 & 1.816 & 0.184 \\ 10 & 0.308 & 1.777 & 0.223 \\ 12 & 0.266 & 1.716 & 0.284 \\ \hline \end{tabular}

Step by Step Solution

There are 3 Steps involved in it

1 Expert Approved Answer
Step: 1 Unlock blur-text-image
Question Has Been Solved by an Expert!

Get step-by-step solutions from verified subject matter experts

Step: 2 Unlock
Step: 3 Unlock

Students Have Also Explored These Related General Management Questions!