

Question: answer queations 12-17 asap please! QUESTION 12 In a gasoline-blending plant the octane rating of their products has been measured. Observations from seven such samples
answer queations 12-17 asap please! 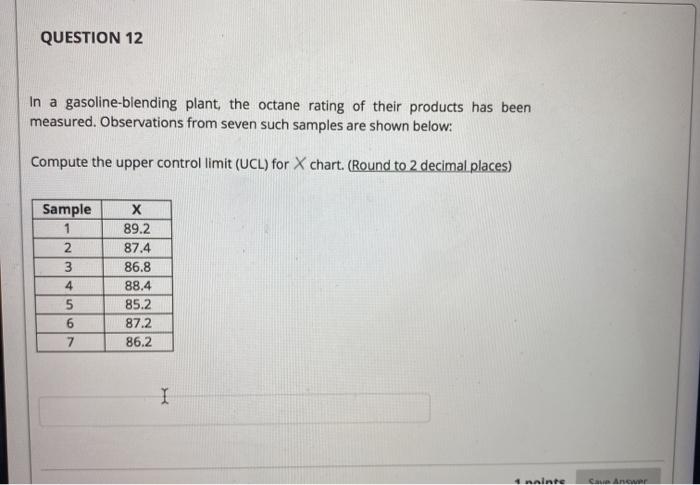
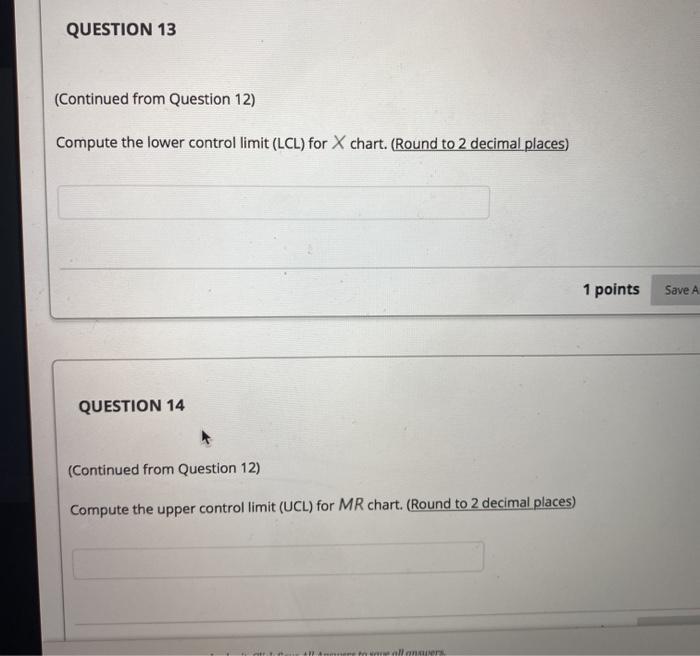
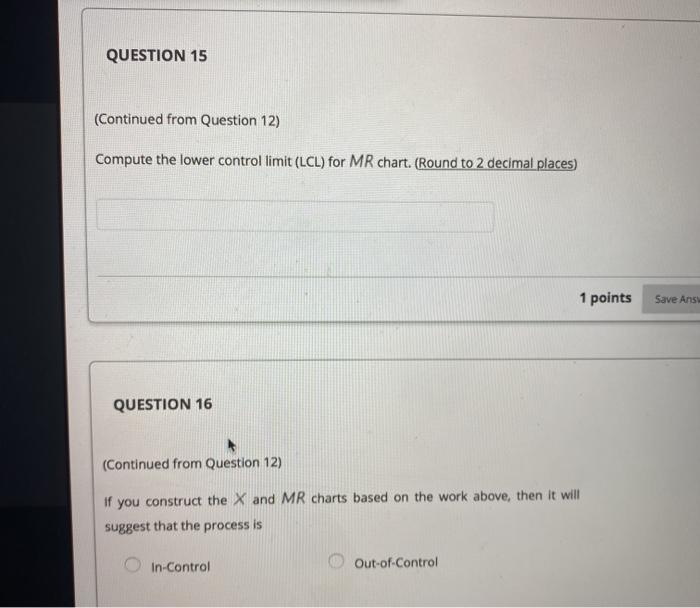
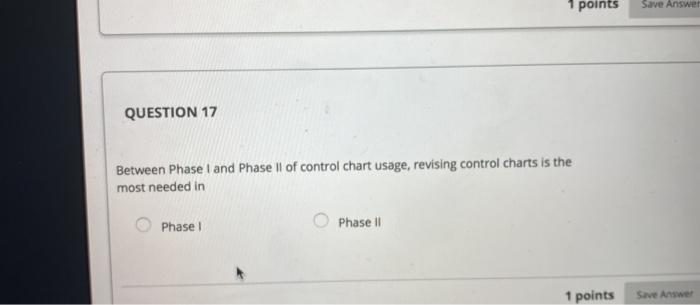
QUESTION 12 In a gasoline-blending plant the octane rating of their products has been measured. Observations from seven such samples are shown below: Compute the upper controllimit (UCL) for X chart. (Round to 2 decimal places) Sample 1 2 3 4 5 6 7 89.2 87.4 86.8 88.4 85.2 87.2 86.2 I 4 nainte Cu Ane QUESTION 13 (Continued from Question 12) Compute the lower control limit (LCL) for X chart. (Round to 2 decimal places) 1 points Save A QUESTION 14 (Continued from Question 12) Compute the upper controllimit (UCL) for MR chart. (Round to 2 decimal places) Plan QUESTION 15 (Continued from Question 12) Compute the lower control limit (LCL) for MR chart. (Round to 2 decimal places) 1 points Save Ans QUESTION 16 (Continued from Question 12) If you construct the X and MR charts based on the work above, then it will suggest that the process is In-Control Out-of-Control 1 points Save Answer QUESTION 17 Between Phase I and Phase II of control chart usage, revising control charts is the most needed in Phase 1 Phase 11 1 points Save
Step by Step Solution
There are 3 Steps involved in it
1 Expert Approved Answer
Step: 1 Unlock

Question Has Been Solved by an Expert!
Get step-by-step solutions from verified subject matter experts
Step: 2 Unlock
Step: 3 Unlock