Question: LS EXERCISE: EXAMINING DATA 1 Exercise 5: Examining Data Mkt 5370 Fall 2020 Overview This exercise will help you get comfortable with SPSS, which is
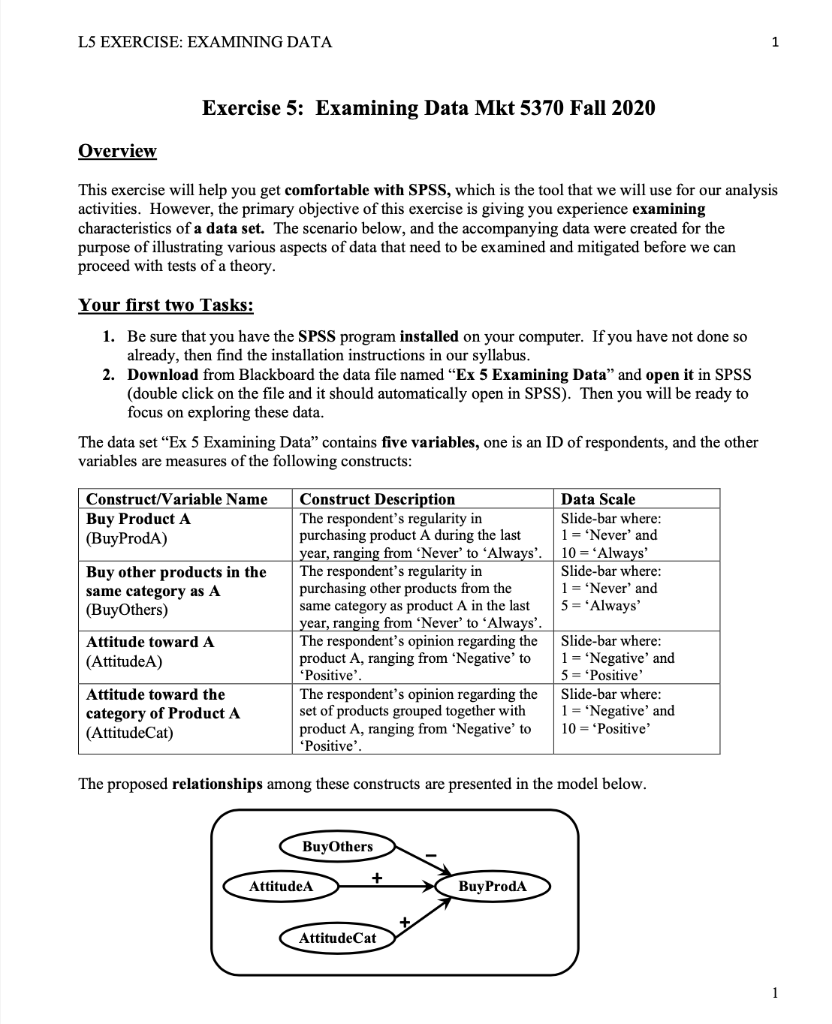
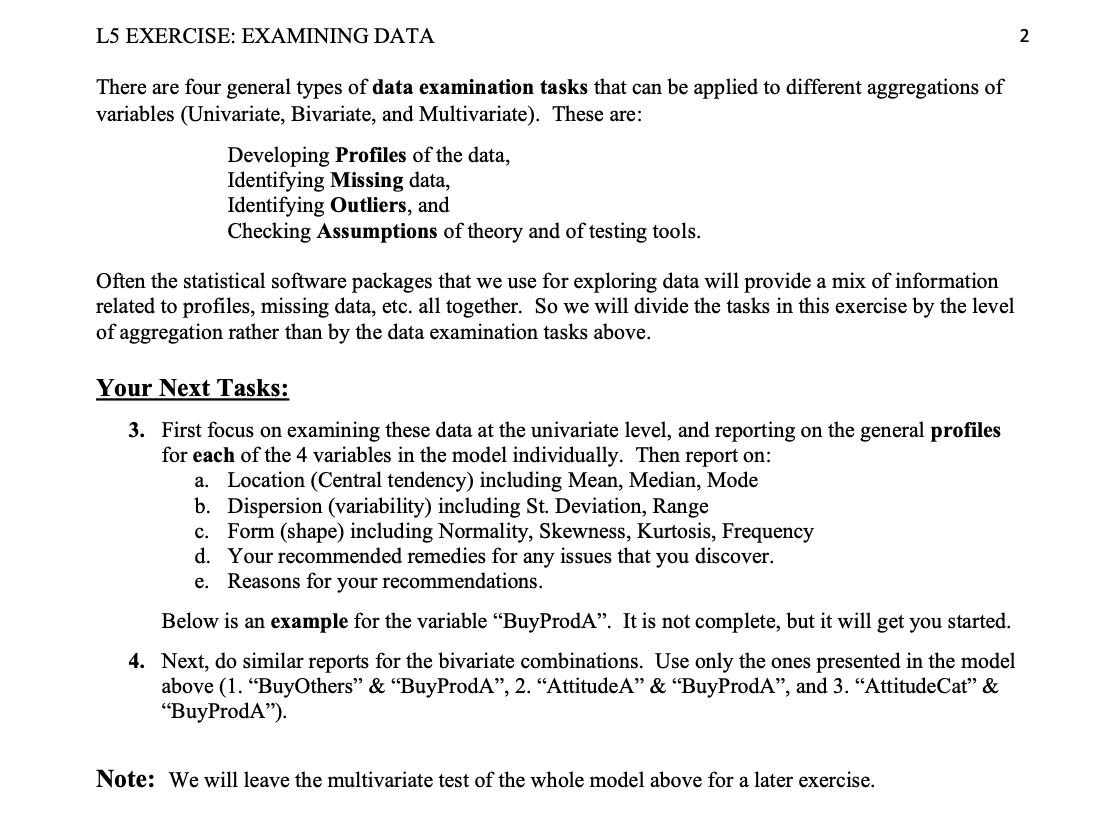
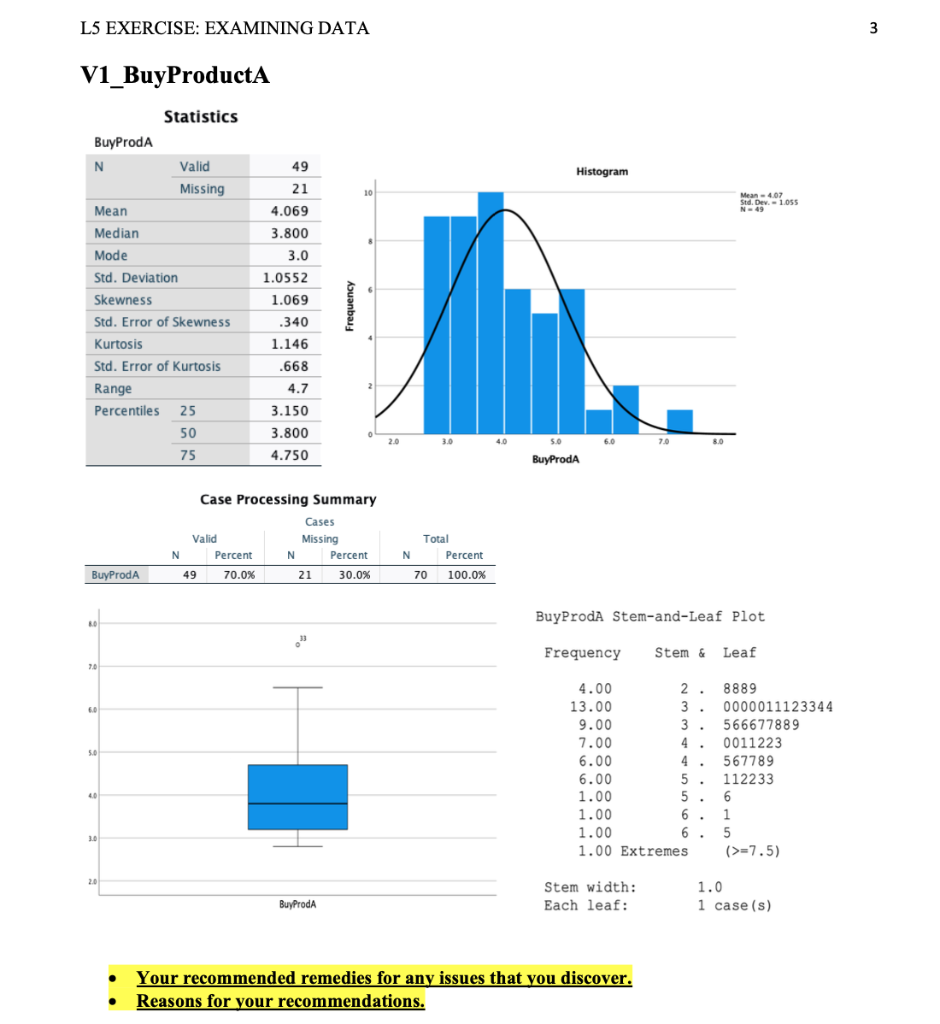
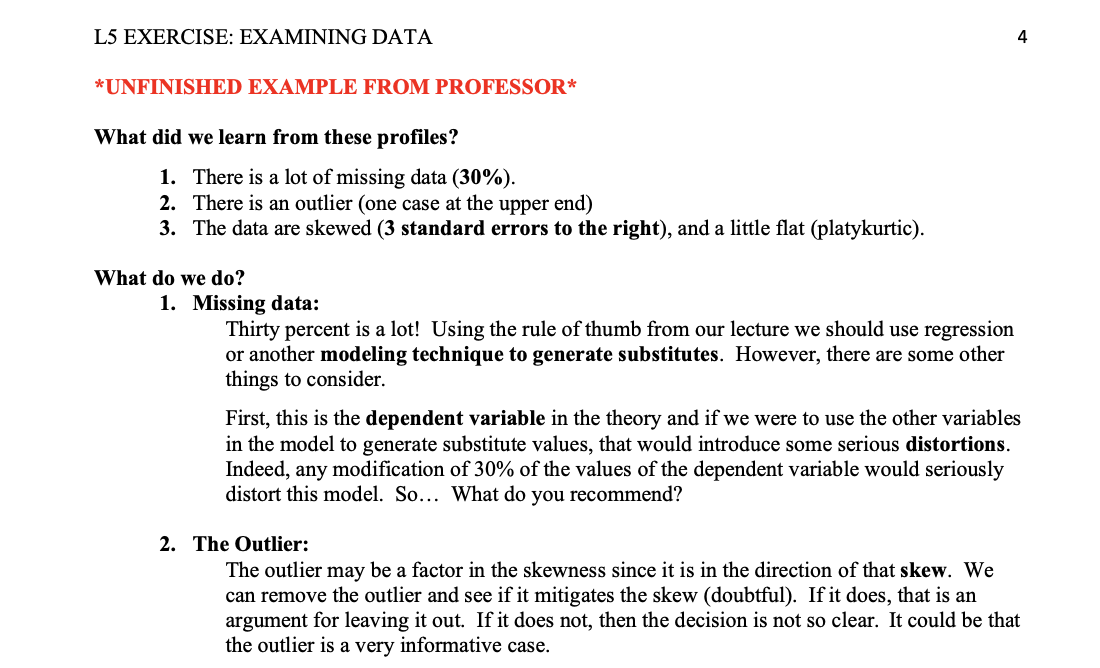
LS EXERCISE: EXAMINING DATA 1 Exercise 5: Examining Data Mkt 5370 Fall 2020 Overview This exercise will help you get comfortable with SPSS, which is the tool that we will use for our analysis activities. However, the primary objective of this exercise is giving you experience examining characteristics of a data set. The scenario below, and the accompanying data were created for the purpose of illustrating various aspects of data that need to be examined and mitigated before we can proceed with tests of a theory. Your first two Tasks: 1. Be sure that you have the SPSS program installed on your computer. If you have not done so already, then find the installation instructions in our syllabus. 2. Download from Blackboard the data file named Ex 5 Examining Data" and open it in SPSS (double click on the file and it should automatically open in SPSS). Then you will be ready to focus on exploring these data. The data set Ex 5 Examining Data" contains five variables, one is an ID of respondents, and the other variables are measur of the following constructs: Construct/Variable Name Buy Product A (Buy ProdA) Buy other products in the same category as A (BuyOthers) Data Scale Slide-bar where: 1 = 'Never and 10 = 'Always' Slide-bar where: 1 = 'Never' and 5 = "Always' Construct Description The respondent's regularity in purchasing product A during the last year, ranging from 'Never' to 'Always' The respondent's regularity in purchasing other products from the same category as product A in the last year, ranging from "Never' to 'Always'. The respondent's opinion regarding the product A, ranging from 'Negative to 'Positive'. The respondent's opinion regarding the set of products grouped together with product A, ranging from 'Negative to "Positive'. Attitude toward A (AttitudeA) Slide-bar where: 1 = 'Negative' and 5='Positive' Slide-bar where: 1 = 'Negative' and 10 = 'Positive Attitude toward the category of Product A (AttitudeCat) The proposed relationships among these constructs are presented in the model below. BuyOthers AttitudeA + Buy Proda AttitudeCat 1 L5 EXERCISE: EXAMINING DATA 2. There are four general types of data examination tasks that can be applied to different aggregations of variables (Univariate, Bivariate, and Multivariate). These are: Developing Profiles of the data, Identifying Missing data, Identifying Outliers, and Checking Assumptions of theory and of testing tools. Often the statistical software packages that we use for exploring data will provide a mix of information related to profiles, missing data, etc. all together. So we will divide the tasks in this exercise by the level of aggregation rather than by the data examination tasks above. Your Next Tasks: a. 3. First focus on examining these data at the univariate level, and reporting on the general profiles for each of the 4 variables in the model individually. Then report on: Location (Central tendency) including Mean, Median, Mode b. Dispersion (variability) including St. Deviation, Range c. Form (shape) including Normality, Skewness, Kurtosis, Frequency d. Your recommended remedies for any issues that you discover. e. Reasons for your recommendations. Below is an example for the variable Buy ProdA. It is not complete, but it will get you started. 4. Next, do similar reports for the bivariate combinations. Use only the ones presented in the model above (1. BuyOthers & Buy ProdA, 2. AttitudeA & BuyProdA, and 3. AttitudeCat & Buy ProdA"). Note: We will leave the multivariate test of the whole model above for a later exercise. LS EXERCISE: EXAMINING DATA 3 V1_Buy ProductA 49 Histogram 21 4.069 Mean 40 Std. Dev. - 1055 N-49 Statistics Buy ProdA N. Valid Missing Mean Median Mode Std. Deviation Skewness Std. Error of Skewness Kurtosis Std. Error of Kurtosis Range Percentiles 25 50 75 3.800 3.0 1.0552 1.069 Frequency .340 1.146 .668 4.7 3.150 3.800 4.750 2.0 6.0 7.0 8.0 5.0 BuyProda Case Processing Summary Cases Valid Missing N Percent N Percent 49 70.0% % 21 30.0% Total N Percent 70 100.0% BuyProdA Buy ProdA Stem-and-Leaf Plot RO . Frequency Stem & Leaf 7.0 5.0 4.00 2. 8889 13.00 3. 0000011123344 9.00 3. 566677889 7.00 4. 0011223 6.00 4. 567789 6.00 5. 112233 1.00 5. 6 1.00 6. 1 1.00 6. 5 1.00 Extremes (>=7.5) 40 3.0 2.0 Stem width: Each leaf : 1.0 1 case (s) Buy Proda Your recommended remedies for any issues that you discover. Reasons for your recommendations. L5 EXERCISE: EXAMINING DATA 4 *UNFINISHED EXAMPLE FROM PROFESSOR* What did we learn from these profiles? 1. There is a lot of missing data (30%). 2. There is an outlier (one case at the upper end) 3. The data are skewed (3 standard errors to the right), and a little flat (platykurtic). What do we do? 1. Missing data: Thirty percent is a lot! Using the rule of thumb from our lecture we should use regression or another modeling technique to generate substitutes. However, there are some other things to consider. First, this is the dependent variable in the theory and if we were to use the other variables in the model to generate substitute values, that would introduce some serious distortions. Indeed, any modification of 30% of the values of the dependent variable would seriously distort this model. So... What do you recommend? 2. The Outlier: The outlier may be a factor in the skewness since it is in the direction of that skew. We can remove the outlier and see if it mitigates the skew (doubtful). If it does, that is an argument for leaving it out. If it does not, then the decision is not so clear. It could be that the outlier is a very informative case. LS EXERCISE: EXAMINING DATA 5 V2_BuyOthers Statistics BuyOthers N. Histogram Valid Missing Mean - 194 Std. Dev. - 875 N-57 Mean Median Mode 57 13 1.944 1.900 2.0 .8751 .457 .316 -.258 .623 3.4 1.350 1.900 2.500 Std. Deviation Skewness Std. Error of Skewness Kurtosis Std. Error of Kurtosis Range Percentiles 25 50 75 Frequency 1.0 2.0 3.0 4.0 BuyOthers Case Processing Summary Cases Valid Missing N Percent N Percent 57 81.4% 13 18.6% Total N. Percent 70 100.0% BuyOthers 48 BuyOthers Stem-and-Leaf Plot Frequency Stem & Leaf 3.0 20 1.00 7.00 10.00 12.00 12.00 8.00 2.00 5.00 0 . 0. 1. 1 2. 2. 3. 3. 4 5578899 0133334444 555666788999 000001122244 55667888 23 77788 . 10 Stem width: Each leaf : 1.0 1 case (s) BuyOthers . Your recommended remedies for any issues that you discover. Reasons for your recommendations. . L5 EXERCISE: EXAMINING DATA 6 Histogram 10 Mean - 2.86 Std. Dev.-775 N-61 V3_AttitudeA Statistics AttitudeA N. Valid Missing Mean Median Mode Std. Deviation Skewness Std. Error of Skewness Kurtosis Std. Error of Kurtosis Range Percentiles 25 50 75 61 9 2.856 3.000 3.3 .7760 -.274 .306 -.208 .604 3.5 2.200 3.000 3.400 11 1.0 2.0 3.0 4.0 5.0 Attitude Case Processing Summary Cases Valid Missing N Percent N Percent 61 87.1% 9 12.9% Total N Percent 70 100.0% Attitude 5.0 AttitudeA Stem-and-Leaf Plot Frequency Stem & Leaf 4.0 3.00 5.00 10 10.00 9.00 21.00 9.00 2.00 2.00 1. 123 1 56799 2. 0111122244 2. 555667789 3. 000001111222333333444 3. 555666677 4. 00 4. 56 2.0 1.0 Stem width: Each leaf : : 1.0 1 case (s) Attitude Your recommended remedies for any issues that you discover. Reasons for your recommendations. . LS EXERCISE: EXAMINING DATA 7 V4 AttitudeCat Histogram 10 Mean 4.76 Std. Dev.-832 N-63 Statistics AttitudeCat N Valid 63 Missing 7 Mean 4.759 Median 4.900 Mode 5.00 Std. Deviation .8319 Skewness -.139 Std. Error of Skewness .302 Kurtosis -917 Std. Error of Kurtosis .595 Range 2.9 Percentiles 25 4.100 50 4.900 75 5.300 a. Multiple modes exist. The smallest value is shown Frequency 3.0 4.0 6.0 7.0 5.0 AttitudeCat Case Processing Summary Cases Valid Missing N Percent N Percent 63 90.0% % 7 10.0% Total N Percent 70 100.0% AttitudeCat 70 AttitudeCat Stem-and-Leaf Plot Frequency Stem & Leaf 5.0 6.00 7.00 11.00 9.00 17.00 7.00 6.00 3. 333344 3. 6677899 4. 01122333444 4. 557888999 5. 00000111122222344 5. 5668999 6. 000112 4.0 3.0 Stem width: Each leaf : 1.0 1 case(s) AttitudeCat . Your recommended remedies for any issues that you discover. Reasons for your recommendations. . LS EXERCISE: EXAMINING DATA 1 Exercise 5: Examining Data Mkt 5370 Fall 2020 Overview This exercise will help you get comfortable with SPSS, which is the tool that we will use for our analysis activities. However, the primary objective of this exercise is giving you experience examining characteristics of a data set. The scenario below, and the accompanying data were created for the purpose of illustrating various aspects of data that need to be examined and mitigated before we can proceed with tests of a theory. Your first two Tasks: 1. Be sure that you have the SPSS program installed on your computer. If you have not done so already, then find the installation instructions in our syllabus. 2. Download from Blackboard the data file named Ex 5 Examining Data" and open it in SPSS (double click on the file and it should automatically open in SPSS). Then you will be ready to focus on exploring these data. The data set Ex 5 Examining Data" contains five variables, one is an ID of respondents, and the other variables are measur of the following constructs: Construct/Variable Name Buy Product A (Buy ProdA) Buy other products in the same category as A (BuyOthers) Data Scale Slide-bar where: 1 = 'Never and 10 = 'Always' Slide-bar where: 1 = 'Never' and 5 = "Always' Construct Description The respondent's regularity in purchasing product A during the last year, ranging from 'Never' to 'Always' The respondent's regularity in purchasing other products from the same category as product A in the last year, ranging from "Never' to 'Always'. The respondent's opinion regarding the product A, ranging from 'Negative to 'Positive'. The respondent's opinion regarding the set of products grouped together with product A, ranging from 'Negative to "Positive'. Attitude toward A (AttitudeA) Slide-bar where: 1 = 'Negative' and 5='Positive' Slide-bar where: 1 = 'Negative' and 10 = 'Positive Attitude toward the category of Product A (AttitudeCat) The proposed relationships among these constructs are presented in the model below. BuyOthers AttitudeA + Buy Proda AttitudeCat 1 L5 EXERCISE: EXAMINING DATA 2. There are four general types of data examination tasks that can be applied to different aggregations of variables (Univariate, Bivariate, and Multivariate). These are: Developing Profiles of the data, Identifying Missing data, Identifying Outliers, and Checking Assumptions of theory and of testing tools. Often the statistical software packages that we use for exploring data will provide a mix of information related to profiles, missing data, etc. all together. So we will divide the tasks in this exercise by the level of aggregation rather than by the data examination tasks above. Your Next Tasks: a. 3. First focus on examining these data at the univariate level, and reporting on the general profiles for each of the 4 variables in the model individually. Then report on: Location (Central tendency) including Mean, Median, Mode b. Dispersion (variability) including St. Deviation, Range c. Form (shape) including Normality, Skewness, Kurtosis, Frequency d. Your recommended remedies for any issues that you discover. e. Reasons for your recommendations. Below is an example for the variable Buy ProdA. It is not complete, but it will get you started. 4. Next, do similar reports for the bivariate combinations. Use only the ones presented in the model above (1. BuyOthers & Buy ProdA, 2. AttitudeA & BuyProdA, and 3. AttitudeCat & Buy ProdA"). Note: We will leave the multivariate test of the whole model above for a later exercise. LS EXERCISE: EXAMINING DATA 3 V1_Buy ProductA 49 Histogram 21 4.069 Mean 40 Std. Dev. - 1055 N-49 Statistics Buy ProdA N. Valid Missing Mean Median Mode Std. Deviation Skewness Std. Error of Skewness Kurtosis Std. Error of Kurtosis Range Percentiles 25 50 75 3.800 3.0 1.0552 1.069 Frequency .340 1.146 .668 4.7 3.150 3.800 4.750 2.0 6.0 7.0 8.0 5.0 BuyProda Case Processing Summary Cases Valid Missing N Percent N Percent 49 70.0% % 21 30.0% Total N Percent 70 100.0% BuyProdA Buy ProdA Stem-and-Leaf Plot RO . Frequency Stem & Leaf 7.0 5.0 4.00 2. 8889 13.00 3. 0000011123344 9.00 3. 566677889 7.00 4. 0011223 6.00 4. 567789 6.00 5. 112233 1.00 5. 6 1.00 6. 1 1.00 6. 5 1.00 Extremes (>=7.5) 40 3.0 2.0 Stem width: Each leaf : 1.0 1 case (s) Buy Proda Your recommended remedies for any issues that you discover. Reasons for your recommendations. L5 EXERCISE: EXAMINING DATA 4 *UNFINISHED EXAMPLE FROM PROFESSOR* What did we learn from these profiles? 1. There is a lot of missing data (30%). 2. There is an outlier (one case at the upper end) 3. The data are skewed (3 standard errors to the right), and a little flat (platykurtic). What do we do? 1. Missing data: Thirty percent is a lot! Using the rule of thumb from our lecture we should use regression or another modeling technique to generate substitutes. However, there are some other things to consider. First, this is the dependent variable in the theory and if we were to use the other variables in the model to generate substitute values, that would introduce some serious distortions. Indeed, any modification of 30% of the values of the dependent variable would seriously distort this model. So... What do you recommend? 2. The Outlier: The outlier may be a factor in the skewness since it is in the direction of that skew. We can remove the outlier and see if it mitigates the skew (doubtful). If it does, that is an argument for leaving it out. If it does not, then the decision is not so clear. It could be that the outlier is a very informative case. LS EXERCISE: EXAMINING DATA 5 V2_BuyOthers Statistics BuyOthers N. Histogram Valid Missing Mean - 194 Std. Dev. - 875 N-57 Mean Median Mode 57 13 1.944 1.900 2.0 .8751 .457 .316 -.258 .623 3.4 1.350 1.900 2.500 Std. Deviation Skewness Std. Error of Skewness Kurtosis Std. Error of Kurtosis Range Percentiles 25 50 75 Frequency 1.0 2.0 3.0 4.0 BuyOthers Case Processing Summary Cases Valid Missing N Percent N Percent 57 81.4% 13 18.6% Total N. Percent 70 100.0% BuyOthers 48 BuyOthers Stem-and-Leaf Plot Frequency Stem & Leaf 3.0 20 1.00 7.00 10.00 12.00 12.00 8.00 2.00 5.00 0 . 0. 1. 1 2. 2. 3. 3. 4 5578899 0133334444 555666788999 000001122244 55667888 23 77788 . 10 Stem width: Each leaf : 1.0 1 case (s) BuyOthers . Your recommended remedies for any issues that you discover. Reasons for your recommendations. . L5 EXERCISE: EXAMINING DATA 6 Histogram 10 Mean - 2.86 Std. Dev.-775 N-61 V3_AttitudeA Statistics AttitudeA N. Valid Missing Mean Median Mode Std. Deviation Skewness Std. Error of Skewness Kurtosis Std. Error of Kurtosis Range Percentiles 25 50 75 61 9 2.856 3.000 3.3 .7760 -.274 .306 -.208 .604 3.5 2.200 3.000 3.400 11 1.0 2.0 3.0 4.0 5.0 Attitude Case Processing Summary Cases Valid Missing N Percent N Percent 61 87.1% 9 12.9% Total N Percent 70 100.0% Attitude 5.0 AttitudeA Stem-and-Leaf Plot Frequency Stem & Leaf 4.0 3.00 5.00 10 10.00 9.00 21.00 9.00 2.00 2.00 1. 123 1 56799 2. 0111122244 2. 555667789 3. 000001111222333333444 3. 555666677 4. 00 4. 56 2.0 1.0 Stem width: Each leaf : : 1.0 1 case (s) Attitude Your recommended remedies for any issues that you discover. Reasons for your recommendations. . LS EXERCISE: EXAMINING DATA 7 V4 AttitudeCat Histogram 10 Mean 4.76 Std. Dev.-832 N-63 Statistics AttitudeCat N Valid 63 Missing 7 Mean 4.759 Median 4.900 Mode 5.00 Std. Deviation .8319 Skewness -.139 Std. Error of Skewness .302 Kurtosis -917 Std. Error of Kurtosis .595 Range 2.9 Percentiles 25 4.100 50 4.900 75 5.300 a. Multiple modes exist. The smallest value is shown Frequency 3.0 4.0 6.0 7.0 5.0 AttitudeCat Case Processing Summary Cases Valid Missing N Percent N Percent 63 90.0% % 7 10.0% Total N Percent 70 100.0% AttitudeCat 70 AttitudeCat Stem-and-Leaf Plot Frequency Stem & Leaf 5.0 6.00 7.00 11.00 9.00 17.00 7.00 6.00 3. 333344 3. 6677899 4. 01122333444 4. 557888999 5. 00000111122222344 5. 5668999 6. 000112 4.0 3.0 Stem width: Each leaf : 1.0 1 case(s) AttitudeCat . Your recommended remedies for any issues that you discover. Reasons for your recommendations


