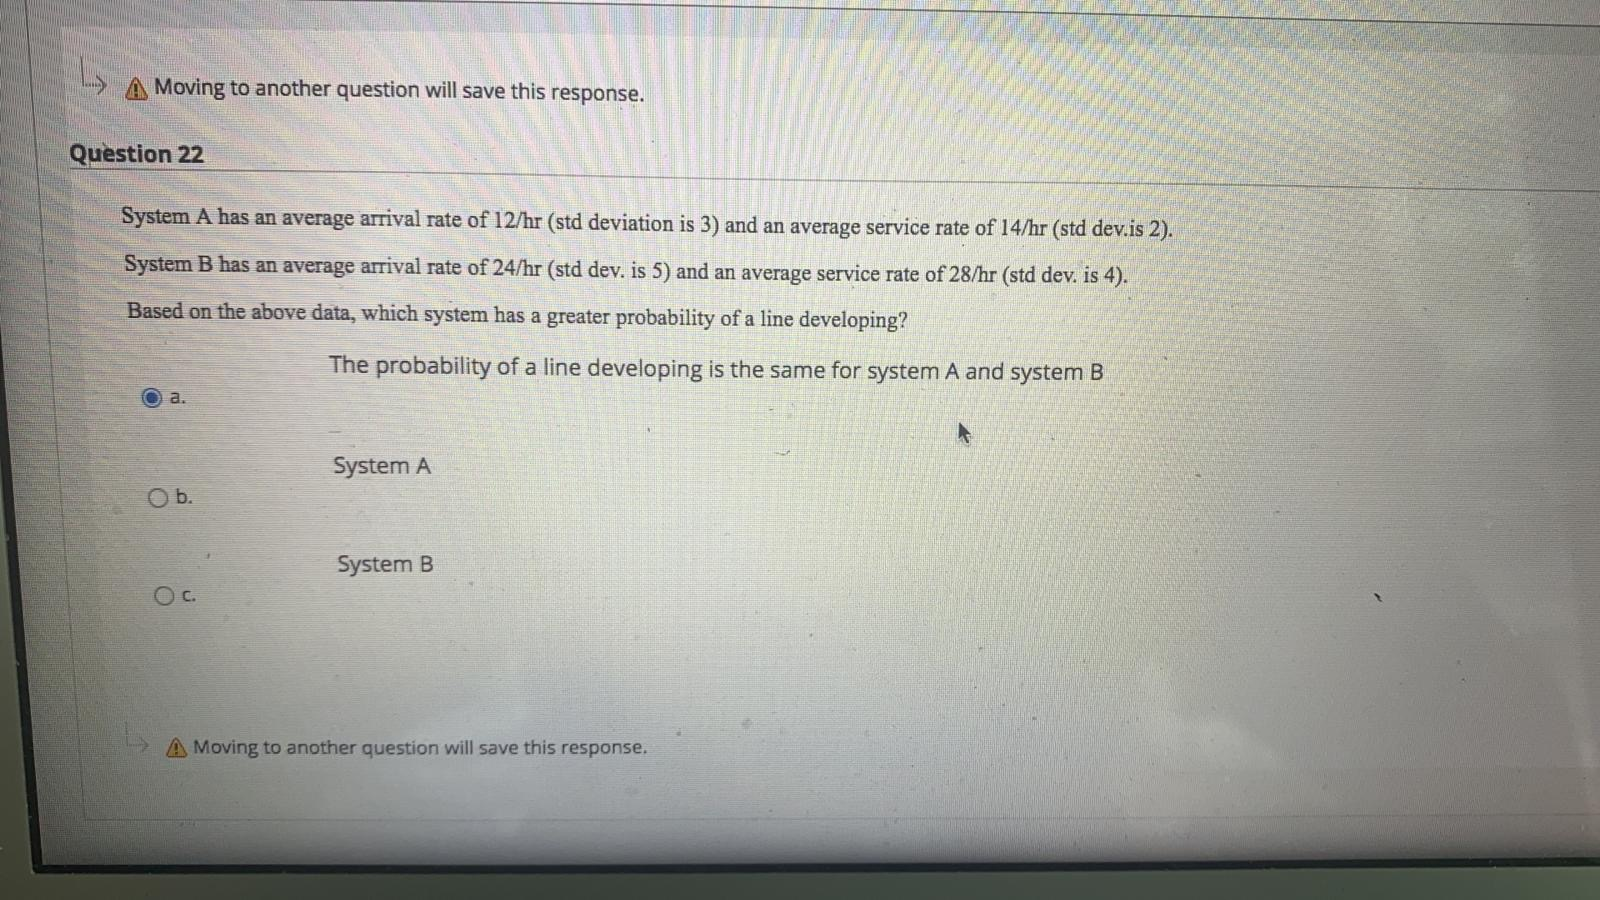
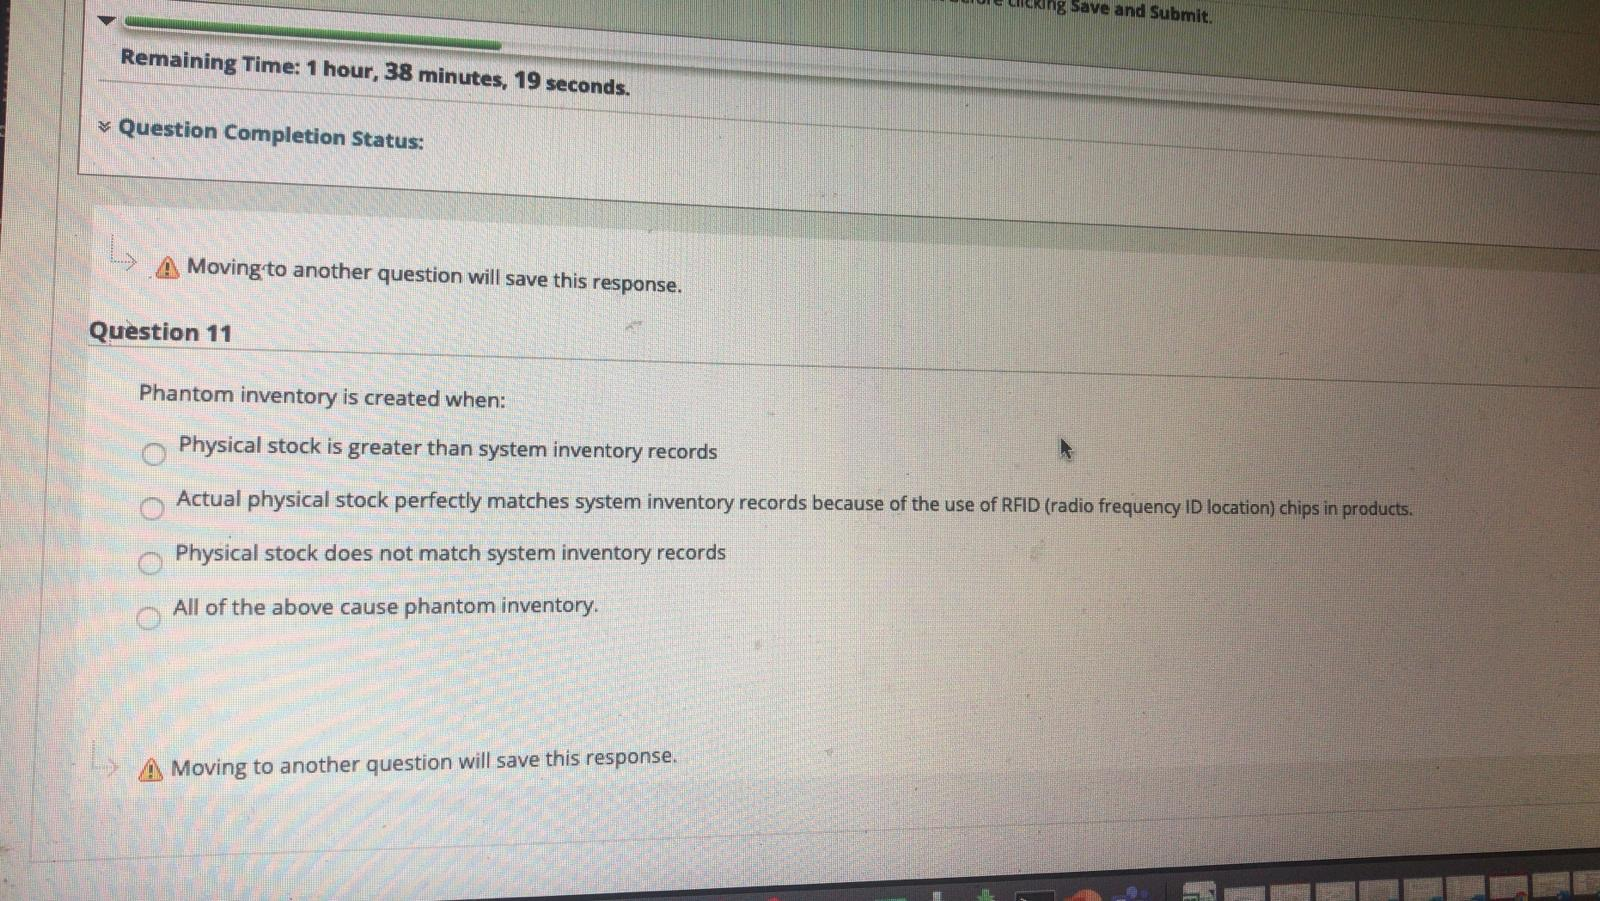
Question: LS Moving to another question will save this response. Question 22 System A has an average arrival rate of 12/hr (std deviation is 3) and

LS Moving to another question will save thisLS Moving to another question will save thisLS Moving to another question will save thisLS Moving to another question will save this

LS Moving to another question will save this response. Question 22 System A has an average arrival rate of 12/hr (std deviation is 3) and an average service rate of 14/hr (std dev.is 2). System B has an average arrival rate of 24/hr (std dev. is 5) and an average service rate of 28/hr (std dev. is 4). Based on the above data, which system has a greater probability of a line developing? The probability of a line developing is the same for system A and system B a. System A O. System B A Moving to another question will save this response. Save and Submit. Remaining Time: 1 hour, 38 minutes, 19 seconds. Question Completion Status: A Moving to another question will save this response. Question 11 Phantom inventory is created when: Physical stock is greater than system inventory records Actual physical stock perfectly matches system inventory records because of the use of RFID (radio frequency ID location) chips in products. Physical stock does not match system inventory records All of the above cause phantom inventory. A Moving to another question will save this response. Before clicking Save and Submit. Course Outline-P Remaining Time: 1 hour, 43 minutes, 57 seconds. Question Completion Status: A Moving to another question will save this response. estion 8 Question 8 of 44 In a shop, the average rate at which customers arrive 1 (lambda) per hour = 10 customers. The average rate at which customers are served p (mu) = 12 customers served per hour. Could a waiting line form? 10 points Save Answer mum a. No - because customers come in precisely @10 per hour No, because the average service rate is higher than the average customer arrival rate Db. Yes, because there is variability in both arrival and service rates Question 8 of 44 Moving to another question will save this response. Question Completion Status: A Moving to another question will save this response. Question 7 Question 10 points Baruch College data shows that demand for Apps Design 101 has been changing over the last 5 years: Year Actual Demand 1 5500 2: 5700 3 6000 4 5900 5 5300 What is the exponentially smoothed forecast for year 6, with a smoothing constant alpha (a) of 0.4? Assume a forecast for year 4 (not for year 5) of 6300? Ft+1 = (alpha)Dt + (1-alpha) Ft 5500 b. 5632 Oc 6279 O d. 5804

Step by Step Solution

There are 3 Steps involved in it

1 Expert Approved Answer
Step: 1 Unlock blur-text-image
Question Has Been Solved by an Expert!

Get step-by-step solutions from verified subject matter experts

Step: 2 Unlock
Step: 3 Unlock

Students Have Also Explored These Related General Management Questions!