

Question: LT copy the mist and second columns ICO ICH WIT variables x and g respectively. Then perform the following operations: Fit a quartic (4th
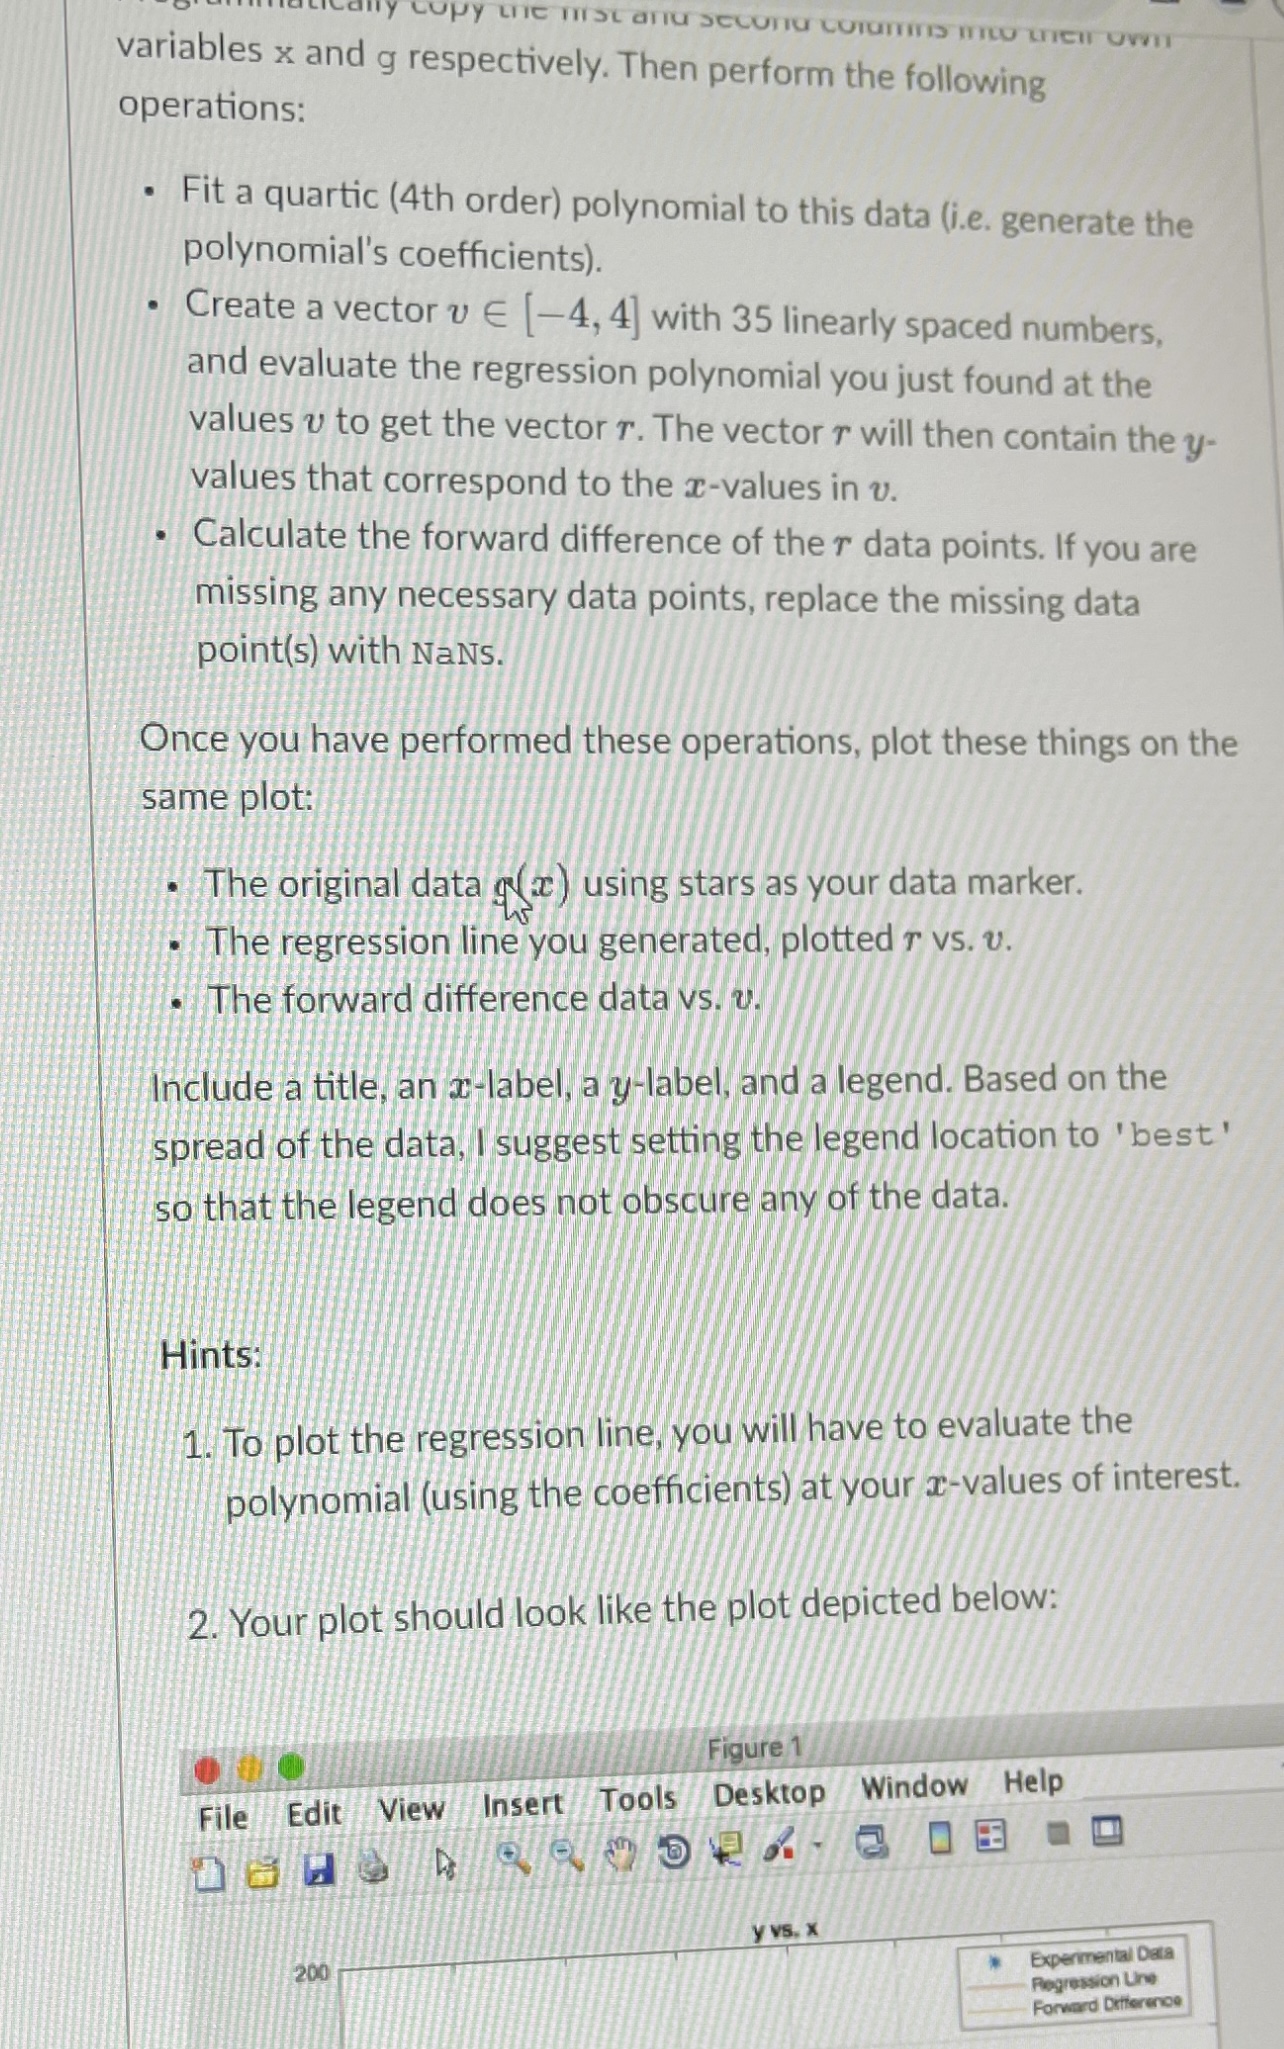
LT copy the mist and second columns ICO ICH WIT variables x and g respectively. Then perform the following operations: Fit a quartic (4th order) polynomial to this data (i.e. generate the polynomial's coefficients). Create a vector v E [-4, 4] with 35 linearly spaced numbers, and evaluate the regression polynomial you just found at the T values to get the vector r. The vector will then contain the y- values that correspond to the x-values in v. Calculate the forward difference of the r data points. If you are missing any necessary data points, replace the missing data point(s) with NaNs. Once you have performed these operations, plot these things on the same plot: The original data (a) using stars as your data marker. The regression line you generated, plotted r vs. v. The forward difference data vs. u. Include a title, an x-label, a y-label, and a legend. Based on the spread of the data, I suggest setting the legend location to 'best' so that the legend does not obscure any of the data. Hints: 1. To plot the regression line, you will have to evaluate the polynomial (using the coefficients) at your x-values of interest. 2. Your plot should look like the plot depicted below: File Figure 1 Edit View Insert Tools Desktop Window Help 200 y vs. x Experimental Data Regression Line Forward Difference
Step by Step Solution
There are 3 Steps involved in it

Get step-by-step solutions from verified subject matter experts