

Question: LT MyLab Statistics Homework X P Do Homework - 3.3 Homework X X C . mylab.pearson.com/Student/PlayerHomework.aspx?homeworkld=6337065008questionld=28flushed=falseBold=7114635&back=https://mylab.pearson.com/Student/DoHomework.asp... MATH-1040-11 Fall 2022 (41418) Haley Carolyn Fanning 09/17/22 8:14
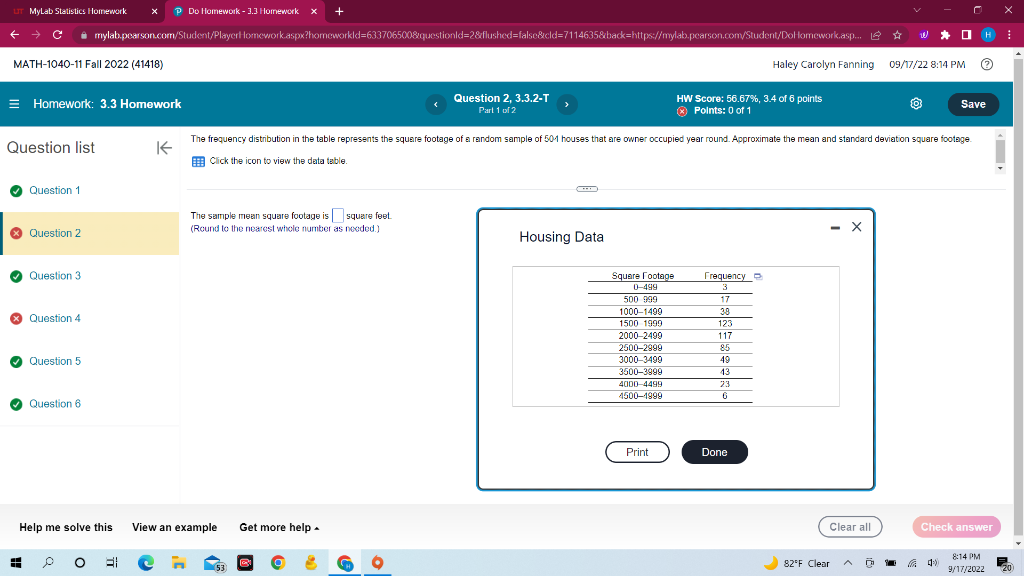
LT MyLab Statistics Homework X P Do Homework - 3.3 Homework X X C . mylab.pearson.com/Student/PlayerHomework.aspx?homeworkld=6337065008questionld=28flushed=falseBold=7114635&back=https://mylab.pearson.com/Student/DoHomework.asp... MATH-1040-11 Fall 2022 (41418) Haley Carolyn Fanning 09/17/22 8:14 PM = Homework: 3.3 Homework Question 2, 3.3.2-T HW Score: 56.67%, 3.4 of 6 points Part 1 of 2 Points: 0 of 1 Save Question list The frequency distribution in the table represents the square footage of a random sample of 501 houses that are owner occupied year round. Approximate the mean and standard deviation square footage "if Click the icon to view the data table. Question 1 The sample mean square footage is | | square feet * Question 2 (Round to the nearest whole number as needed. ) X Housing Data Question 3 Square Footage Frequency D-489 500 939 17 1000-1499 * Question 4 1500-1999 123 2000-2499 117 2500-2899 85 Question 5 3000-349 3500-3999 43 4000-4499 23 4500-1999 Question 6 Print Done Help me solve this View an example Get more help - Clear all Check answer O 825F Clear ADA 8:14 PM 9/17/2022
Step by Step Solution
There are 3 Steps involved in it

Get step-by-step solutions from verified subject matter experts