

Question: Ma Please complete #3 by Matlab code and matrix C is in #1 %% #3 % % WRITE CODE BELOW: % Step 1: Using matrix
Ma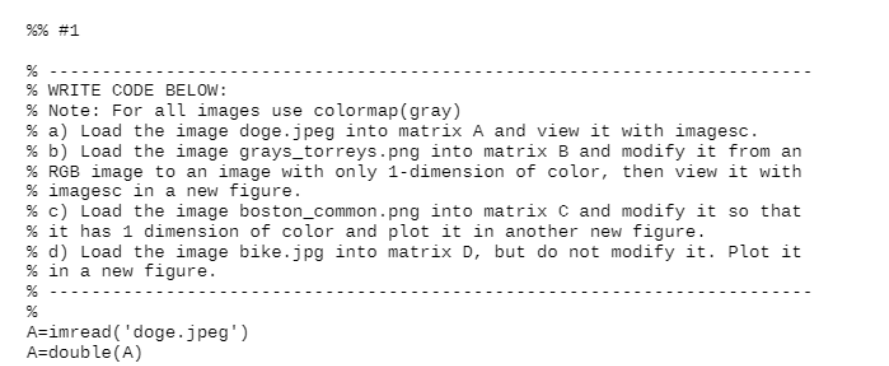
Please complete #3 by Matlab code and matrix C is in #1
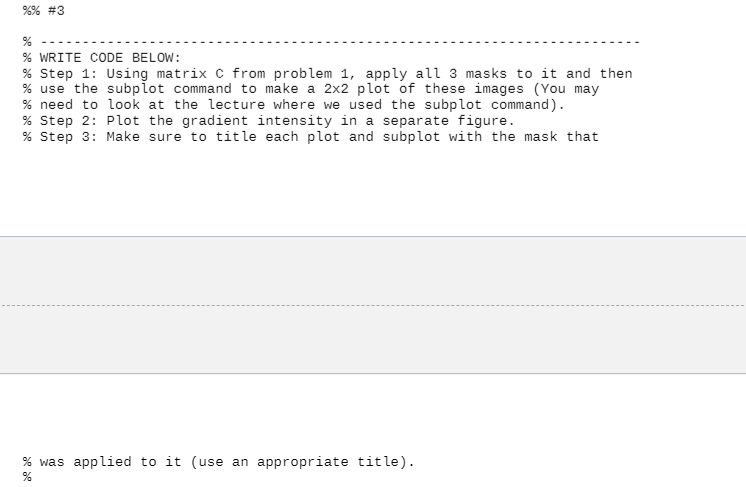
%% #3 % % WRITE CODE BELOW: % Step 1: Using matrix c from problem 1, apply all 3 masks to it and then % use the subplot command to make a 2x2 plot of these images (You may % need to look at the lecture where we used the subplot command). % Step 2: Plot the gradient intensity in a separate figure. % Step 3: Make sure to title each plot and subplot with the mask that % was applied to it (use an appropriate title). % %% #1 % WRITE CODE BELOW: % Note: For all images use colormap(gray) % a) Load the image doge.jpeg into matrix A and view it with imagesc. % b) Load the image grays_torreys.png into matrix B and modify it from an % RGB image to an image with only 1-dimension of color, then view it with % imagesc in a new figure. % c) Load the image boston_common.png into matrix C and modify it so that % it has 1 dimension of color and plot it in another new figure. % d) Load the image bike.jpg into matrix D, but do not modify it. Plot it % in a new figure. A=imread('doge.jpeg') A=double(A) %% #3 % % WRITE CODE BELOW: % Step 1: Using matrix c from problem 1, apply all 3 masks to it and then % use the subplot command to make a 2x2 plot of these images (You may % need to look at the lecture where we used the subplot command). % Step 2: Plot the gradient intensity in a separate figure. % Step 3: Make sure to title each plot and subplot with the mask that % was applied to it (use an appropriate title). % %% #1 % WRITE CODE BELOW: % Note: For all images use colormap(gray) % a) Load the image doge.jpeg into matrix A and view it with imagesc. % b) Load the image grays_torreys.png into matrix B and modify it from an % RGB image to an image with only 1-dimension of color, then view it with % imagesc in a new figure. % c) Load the image boston_common.png into matrix C and modify it so that % it has 1 dimension of color and plot it in another new figure. % d) Load the image bike.jpg into matrix D, but do not modify it. Plot it % in a new figure. A=imread('doge.jpeg') A=double(A)
Step by Step Solution
There are 3 Steps involved in it

Get step-by-step solutions from verified subject matter experts