

Question: Macomb Inc. used Excel to run a least-squares regression analysis on the production cost data resulting in the following output: Regression Statistics Multiple R R
Macomb Inc. used Excel to run a least-squares regression analysis on the production cost data resulting in the following output: Regression Statistics Multiple R R Square Observations 0.9834 0.9596 30 Coefficients Intercept Production units 174,980 11.53 (X) Standard Error T Stat P-Value 61,580 2.84 0.021 0.9265 12.44 0.000 What total cost would Macomb predict for a month in which production is 2,000 units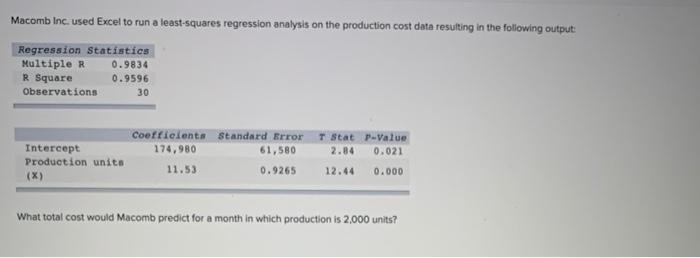
Step by Step Solution
There are 3 Steps involved in it
1 Expert Approved Answer
Step: 1 Unlock

Question Has Been Solved by an Expert!
Get step-by-step solutions from verified subject matter experts
Step: 2 Unlock
Step: 3 Unlock