

Question: Macomb Inc, used Excel to run a least-squares regression analysis on the production cost data resulting in the following output Regression Statistics Multiple R 0.9733
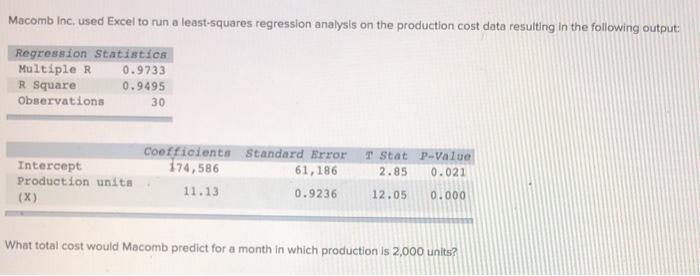

Macomb Inc, used Excel to run a least-squares regression analysis on the production cost data resulting in the following output Regression Statistics Multiple R 0.9733 R Square Observations 0.9495 30 Coefficients Standard Error 174,586 61,186 11.13 0.9236 T Stat p-value 2.85 0.021 Intercept Production units (X) 12.05 0.000 What total cost would Macomb predict for a month in which production is 2,000 units? Multiple Choice 520843 573.700 563.033 $195.000
Step by Step Solution
There are 3 Steps involved in it
1 Expert Approved Answer
Step: 1 Unlock

Question Has Been Solved by an Expert!
Get step-by-step solutions from verified subject matter experts
Step: 2 Unlock
Step: 3 Unlock