

Question: Main question is first picture, second picture is the question10 mentioned in the main question. you use 4. (20 Points) Remember that in Assignment-2 Question-10,
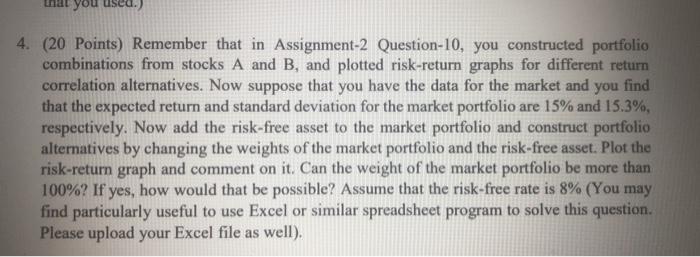
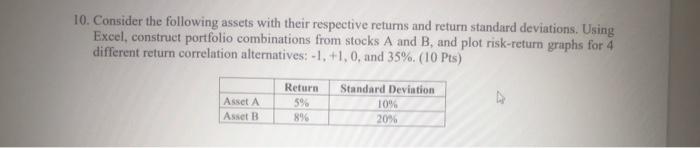
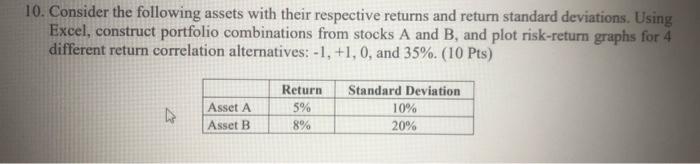
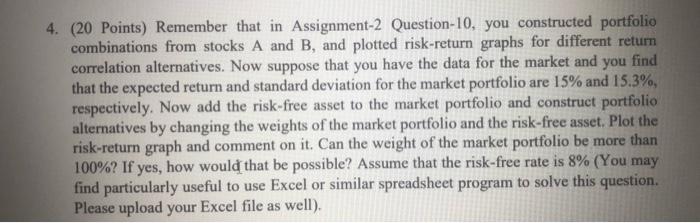
you use 4. (20 Points) Remember that in Assignment-2 Question-10, you constructed portfolio combinations from stocks A and B, and plotted risk-return graphs for different return correlation alternatives. Now suppose that you have the data for the market and you find that the expected return and standard deviation for the market portfolio are 15% and 15.3%, respectively. Now add the risk-free asset to the market portfolio and construct portfolio alternatives by changing the weights of the market portfolio and the risk-free asset. Plot the risk-return graph and comment on it. Can the weight of the market portfolio be more than 100%? If yes, how would that be possible? Assume that the risk-free rate is 8% (You may find particularly useful to use Excel or similar spreadsheet program to solve this question Please upload your Excel file as well). 10. Consider the following assets with their respective retums and return standard deviations. Using Excel, construct portfolio combinations from stocks A and B, and plot risk-return graphs for 4 different return correlation alternatives: -1, +1, 0, and 35% (10 Pts) Asset A Asset B Return 59 896 Standard Deviation 10% 20% 10. Consider the following assets with their respective returns and return standard deviations. Using Excel, construct portfolio combinations from stocks A and B, and plot risk-return graphs for 4 different return correlation alternatives: -1, +1, 0, and 35%. (10 Pts) Return 5% Asset A Asset B Standard Deviation 10% 20% 4. (20 Points) Remember that in Assignment-2 Question-10, you constructed portfolio combinations from stocks A and B, and plotted risk-return graphs for different return correlation alternatives. Now suppose that you have the data for the market and you find that the expected return and standard deviation for the market portfolio are 15% and 15.3%, respectively. Now add the risk-free asset to the market portfolio and construct portfolio alternatives by changing the weights of the market portfolio and the risk-free asset. Plot the risk-return graph and comment on it. Can the weight of the market portfolio be more than 100%? If yes, how would that be possible? Assume that the risk-free rate is 8% (You may find particularly useful to use Excel or similar spreadsheet program to solve this question. Please upload your Excel file as well)
Step by Step Solution
There are 3 Steps involved in it

Get step-by-step solutions from verified subject matter experts