

Question: Major Electronics is a multi-plant assembler of computers and computer products. It has 40 plants located in southern Ontario and greater Montreal. In recent
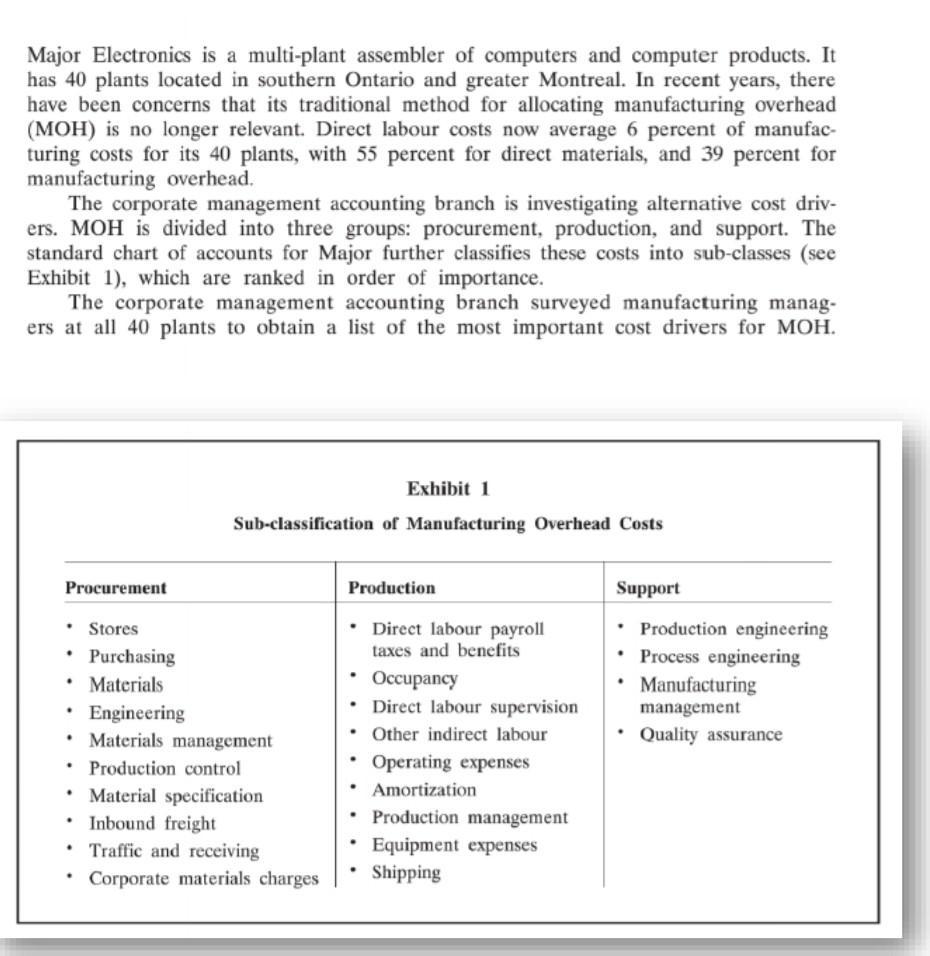
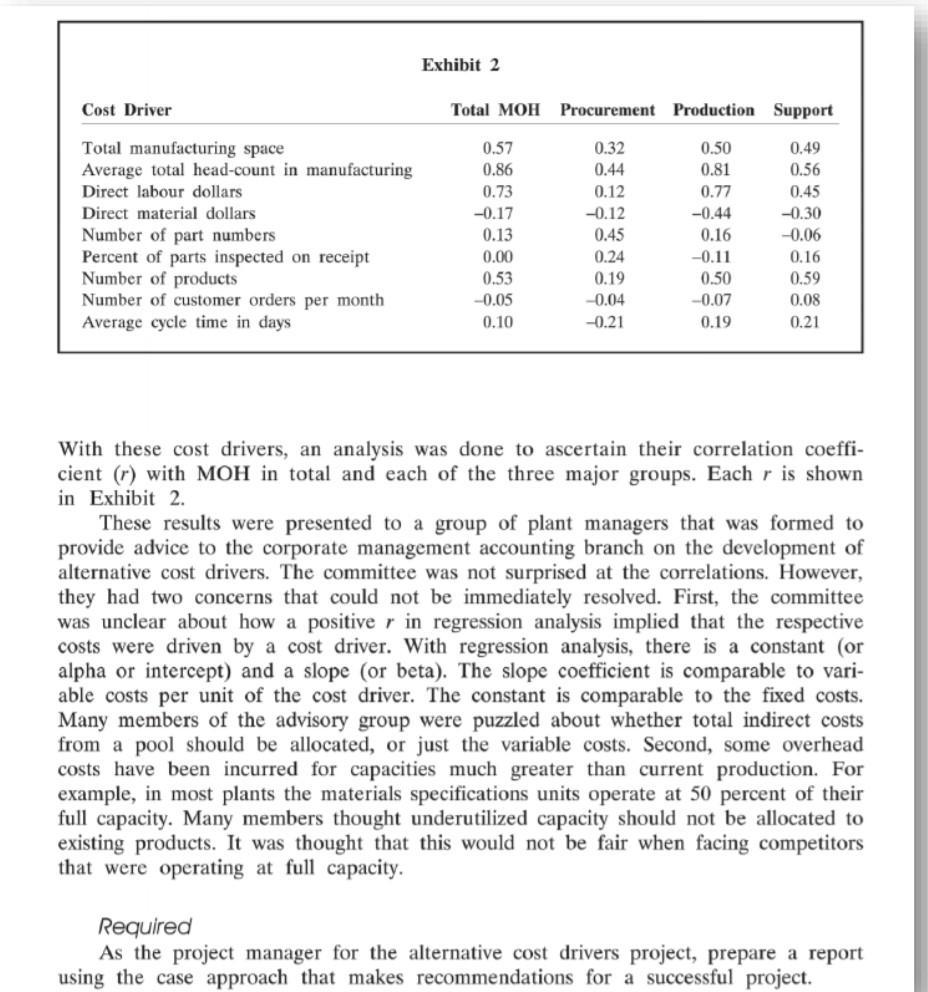
Major Electronics is a multi-plant assembler of computers and computer products. It has 40 plants located in southern Ontario and greater Montreal. In recent years, there have been concerns that its traditional method for allocating manufacturing overhead (MOH) is no longer relevant. Direct labour costs now average 6 percent of manufac- turing costs for its 40 plants, with 55 percent for direct materials, and 39 percent for manufacturing overhead. The corporate management accounting branch is investigating alternative cost driv- ers. MOH is divided into three groups: procurement, production, and support. The standard chart of accounts for Major further classifies these costs into sub-classes (see Exhibit 1), which are ranked in order of importance. The corporate management accounting branch surveyed manufacturing manag- ers at all 40 plants to obtain a list of the most important cost drivers for MOH. Procurement Stores . . Materials Purchasing . Engineering Materials management . Exhibit 1 Sub-classification of Manufacturing Overhead Costs . Production control . Material specification Inbound freight . Traffic and receiving Corporate materials charges . Production Direct labour payroll taxes and benefits Occupancy Direct labour supervision Other indirect labour Operating expenses Amortization Production management Equipment expenses Shipping Support Production engineering Process engineering Manufacturing management Quality assurance Cost Driver Total manufacturing space Average total head-count in manufacturing Direct labour dollars. Direct material dollars Number of part numbers. Percent of parts inspected on receipt Number of products Number of customer orders per month Average cycle time in days Exhibit 2 Total MOH Procurement Production Support 0.50 0.49 0.81 0.56 0.77 0.45 -0.44 -0.30 0.16 -0.06 -0.11 0.16 0.50 0.59 -0.07 0.08 0.19 0.21 0.57 0.86 0.73 -0.17 0.13 0.00 0.53 -0.05 0.10 0.32 0.44 0.12 -0.12 0.45 0.24 0.19 -0.04 -0.21 With these cost drivers, an analysis was done to ascertain their correlation coeffi- cient (r) with MOH in total and each of the three major groups. Each r is shown in Exhibit 2. These results were presented to a group of plant managers that was formed to provide advice to the corporate management accounting branch on the development of alternative cost drivers. The committee was not surprised at the correlations. However, they had two concerns that could not be immediately resolved. First, the committee was unclear about how a positive r in regression analysis implied that the respective costs were driven by a cost driver. With regression analysis, there is a constant (or alpha or intercept) and a slope (or beta). The slope coefficient is comparable to vari- able costs per unit of the cost driver. The constant is comparable to the fixed costs. Many members of the advisory group were puzzled about whether total indirect costs from a pool should be allocated, or just the variable costs. Second, some overhead costs have been incurred for capacities much greater than current production. For example, in most plants the materials specifications units operate at 50 percent of their full capacity. Many members thought underutilized capacity should not be allocated to existing products. It was thought that this would not be fair when facing competitors that were operating at full capacity. Required As the project manager for the alternative cost drivers project, prepare a report using the case approach that makes recommendations for a successful project.
Step by Step Solution
3.36 Rating (159 Votes )
There are 3 Steps involved in it
According to the data Ans Issues 1 Uncertainty about the cost allocation method 2 Overhead cost being much more than the actual production Analysis 1 ... View full answer

Get step-by-step solutions from verified subject matter experts