

Question: Make a BEP graph with the info below. label the break even point , total costs (var + fixed ) , fixed cost and revenue
Make a BEP graph with the info below. label the break even point , total costs (var + fixed ) , fixed cost and revenue 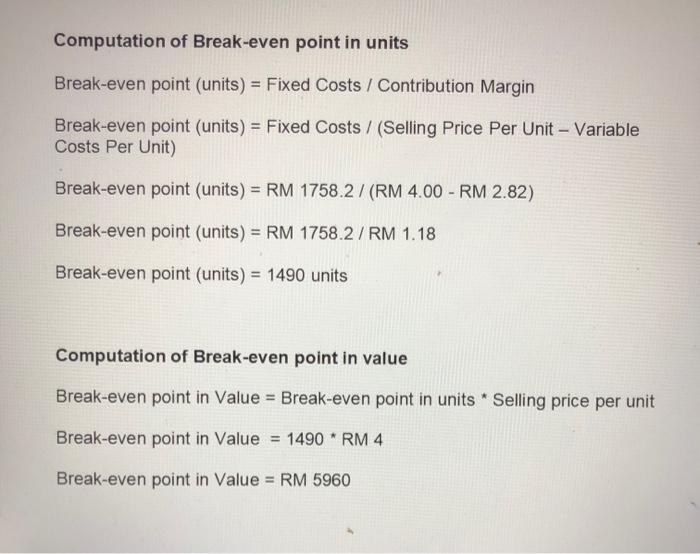
Computation of Break-even point in units Break-even point (units) = Fixed Costs / Contribution Margin - - Break-even point (units) = Fixed Costs/ (Selling Price Per Unit - Variable Costs Per Unit) Break-even point (units) = RM 1758.2 / (RM 4.00 - RM 2.82) Break-even point (units) = RM 1758.2 /RM 1.18 Break-even point (units) = 1490 units Computation of Break-even point in value Break-even point in Value = Break-even point in units * Selling price per unit Break-even point in Value = 1490 * RM 4 Break-even point in Value = RM 5960
Step by Step Solution
There are 3 Steps involved in it
1 Expert Approved Answer
Step: 1 Unlock

Question Has Been Solved by an Expert!
Get step-by-step solutions from verified subject matter experts
Step: 2 Unlock
Step: 3 Unlock