

Question: Make a financial spreadsheet of given below. Your supervisor in the finance department at a Technology Company has asked you to create a worksheet for
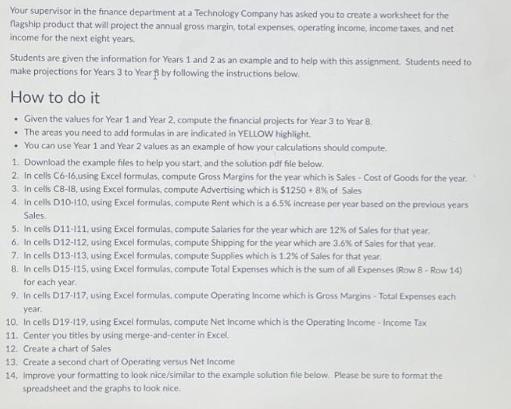
Your supervisor in the finance department at a Technology Company has asked you to create a worksheet for the flagship product that will project the annual gross margin, total expenses, operating income, income taxes, and net income for the next eight years Students are given the information for Years 1 and 2 as an example and to help with this assignment. Students need to make projections for Years 3 to Year 3 by following the instructions below. How to do it . Given the values for Year 1 and Year 2, compute the financial projects for Year 3 to Year 8. The areas you need to add formulas in are indicated in YELLOW highlight. You can use Year 1 and Year 2 values as an example of how your calculations should compute. 1. Download the example files to help you start, and the solution pdf file below. 2. In cells C6-16,using Excel formulas, compute Gross Margins for the year which is Sales - Cost of Goods for the year. 3. In cells C8-18, using Excel formulas, compute Advertising which is $1250 +8% of Sales 4. In cells D10-110, using Excel formulas, compute Rent which is a 6.5% increase per year based on the previous years Sales 5. In cells D11-111, using Excel formulas, compute Salaries for the year which are 12% of Sales for that year, 6. In cells D12-112, using Excel formulas, compute Shipping for the year which are 3.6% of Sales for that year.. 7. In cells D13-113, using Excel formulas, compute Supplies which is 1.2 % of Sales for that year. 8. In cells D15-115, using Excel formulas, compute Total Expenses which is the sum of all Expenses (Row 8-Row 14) for each year. 9. In cells D17-117, using Excel formulas, compute Operating Income which is Gross Margins-Total Expenses each year. 10. In cells D19-119, using Excel formulas, compute Net Income which is the Operating Income-Income Tax 11. Center you tities by using merge-and-center in Excel 12. Create a chart of Sales 13. Create a second chart of Operating versus Net Income 14. Improve your formatting to look nice/similar to the example solution file below. Please be sure to format the spreadsheet and the graphs to look nice.
Step by Step Solution
3.40 Rating (163 Votes )
There are 3 Steps involved in it
Financial Projections Spreadsheet Instructions Download the example files to help you start In cells C616 using Excel formulas compute Gross Margins f... View full answer

Get step-by-step solutions from verified subject matter experts