

Question: Make a Histogram using Microsoft Excel with the given data set below. Please be CREATIVE in presenting the chart. X P(X) 0 0.00097656 0.00976563 2
Make a Histogram using Microsoft Excel with the given data set below. Please be CREATIVE in presenting the chart.
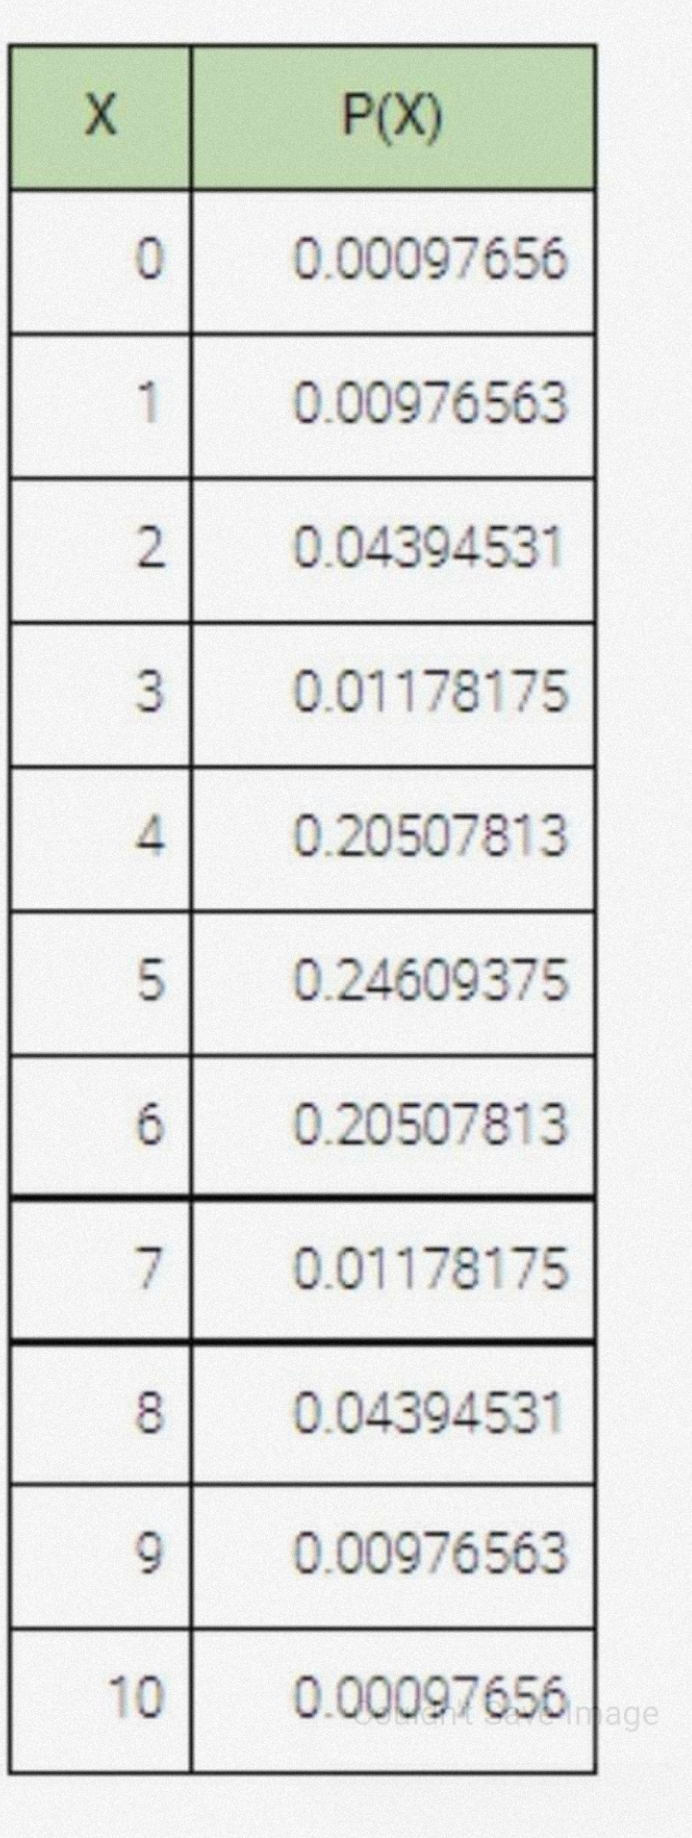
X P(X) 0 0.00097656 0.00976563 2 0.04394531 0.01178175 4 0.20507813 0.24609375 6 0.20507813 7 0.01178175 8 0.04394531 0.00976563 10 0.00097656 age
Step by Step Solution
There are 3 Steps involved in it
1 Expert Approved Answer
Step: 1 Unlock

Question Has Been Solved by an Expert!
Get step-by-step solutions from verified subject matter experts
Step: 2 Unlock
Step: 3 Unlock