

Question: Make A Job's Plot On Excel Using The Following Data. Use An Xy Scatter Plot With A Smooth Line. Make a Job's Plot on
Make A Job's Plot On Excel Using The Following Data. Use An Xy Scatter Plot With A Smooth Line.
Make a Job's Plot on Excel using the following data. Use an xy scatter plot with a smooth line. 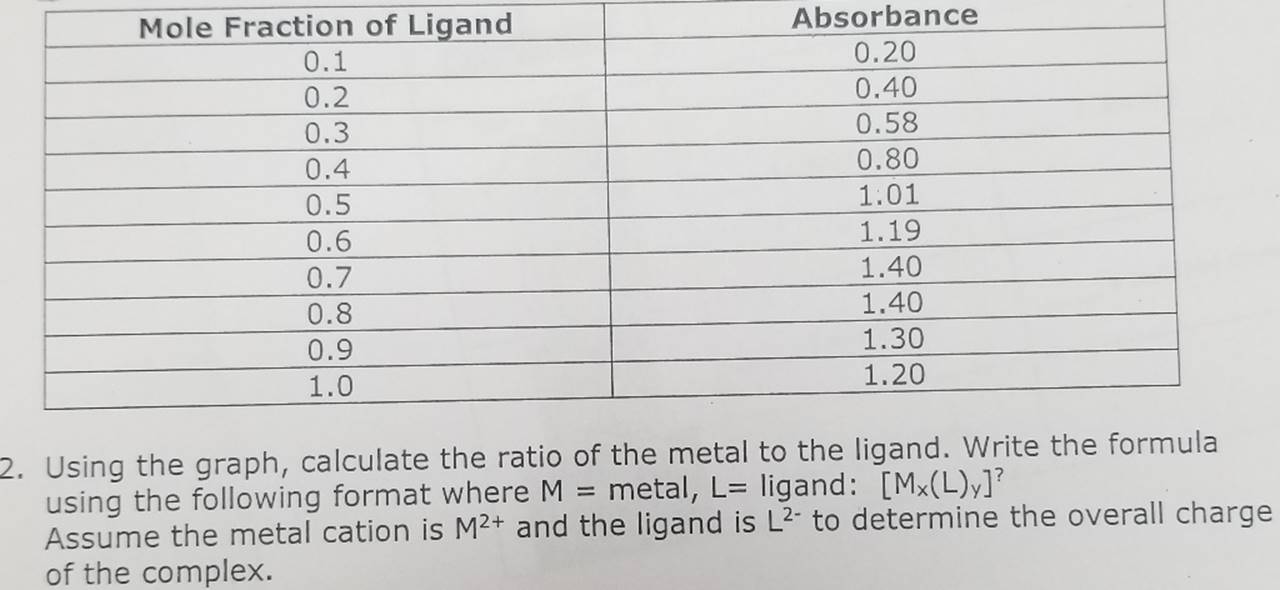
Mole Fraction of Ligand Absorbance 0.1 0.20 0.2 0.40 0.3 0.58 0.4 0.80 0.5 1.01 0.6 1.19 0.7 1.40 0.8 1.40 0.9 1.30 1.0 1.20 2. Using the graph, calculate the ratio of the metal to the ligand. Write the formula using the following format where M = metal, L= ligand: [Mx(L)y]? Assume the metal cation is M2+ and the ligand is L2- to determine the overall charge of the complex.
Step by Step Solution
There are 3 Steps involved in it

Get step-by-step solutions from verified subject matter experts