

Question: Make a stacked bar diagram and answer the question Is reproduction hazardous ? Is reproduction hazardous? If not, then it is difficult to explain
Make a stacked bar diagram and answer the question " Is reproduction hazardous" ?
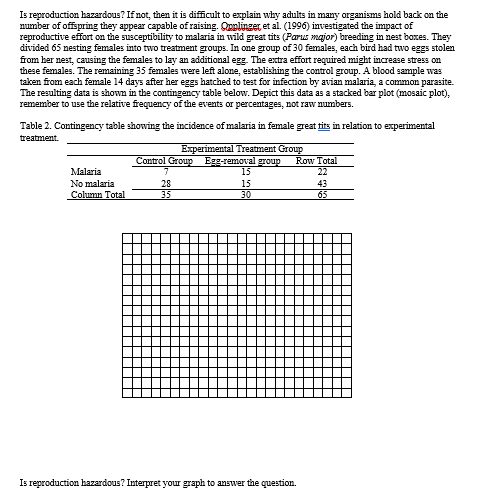
Is reproduction hazardous? If not, then it is difficult to explain why achults in many organisms hold back on the number of offspring they appear capable of raising. Omplinger et al. (1996) investigated the impact of reproductive effort on the susceptibility to malaria in wild great tits (Parus major) breeding in nest boxes. They divided 65 nesting females into two treatment groups. In one group of 30 females, each bird had two eggs stolen from her nest, causing the females to lay an additional egz. The extra effort required might increase stress on these females. The remaining 35 females were left alone, establishing the control group. A blood sample was taken from each female 14 days after her eggs hatched to test for infection by avian malaria, a common parasite The resulting data is shown in the contingency table below. Depict this data as a stacked bar plot (mosaic plot), remember to use the relative frequency of the events or percentages, not raw numbers. Table 2. Contingency table showing the incidence of malaria in female great tits in relation to experimental treatment Experimental Treatment Group Control Group Egg-removal group Row Total Malaria 15 No malaria 28 15 Column Total 35 30 65 7 Is reproduction hazardous? Interpret your graph to answer the question. Is reproduction hazardous? If not, then it is difficult to explain why achults in many organisms hold back on the number of offspring they appear capable of raising. Omplinger et al. (1996) investigated the impact of reproductive effort on the susceptibility to malaria in wild great tits (Parus major) breeding in nest boxes. They divided 65 nesting females into two treatment groups. In one group of 30 females, each bird had two eggs stolen from her nest, causing the females to lay an additional egz. The extra effort required might increase stress on these females. The remaining 35 females were left alone, establishing the control group. A blood sample was taken from each female 14 days after her eggs hatched to test for infection by avian malaria, a common parasite The resulting data is shown in the contingency table below. Depict this data as a stacked bar plot (mosaic plot), remember to use the relative frequency of the events or percentages, not raw numbers. Table 2. Contingency table showing the incidence of malaria in female great tits in relation to experimental treatment Experimental Treatment Group Control Group Egg-removal group Row Total Malaria 15 No malaria 28 15 Column Total 35 30 65 7 Is reproduction hazardous? Interpret your graph to answer the
Step by Step Solution
There are 3 Steps involved in it

Get step-by-step solutions from verified subject matter experts