

Question: make a trade off graph of this information please Use the following information to create a trade-oft graph of these firms Choose the firms that
make a trade off graph of this information please 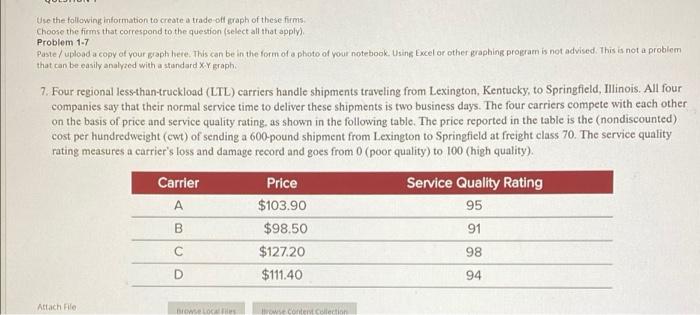
Use the following information to create a trade-oft graph of these firms Choose the firms that correspond to the question select all that apply) Problem 1-7 Paste / upload a copy of your graph here. This can be in the form of a photo of your notebook. Using Excel or other graphing program is not advised. This is not a problem that can be easily analyzed with a standard XX graph 7. Four regional less-than-truckload (LTL) carriers handle shipments traveling from Lexington, Kentucky, to Springfield, Illinois. All four companies say that their normal service time to deliver these shipments is two business days. The four carriers compete with each other on the basis of price and service quality rating, as shown in the following table. The price reported in the table is the (nondiscounted) cost per hundredweight (cwt) of sending a 600-pound shipment from Lexington to Springfield at freight class 70. The service quality rating measures a carrier's loss and damage record and goes from 0 (poor quality) to 100 (high quality). Carrier Price Service Quality Rating A $103.90 95 B $98.50 91 $127.20 98 D $111.40 94 Attach File Brow LOG Hronse content collection Step by Step Solution
There are 3 Steps involved in it
1 Expert Approved Answer
Step: 1 Unlock

Question Has Been Solved by an Expert!
Get step-by-step solutions from verified subject matter experts
Step: 2 Unlock
Step: 3 Unlock