

Question: Make a Vertical AND Horizontal analysis for the company DEUTSCHE LUFTHANSA AG. You can find their financial reports online or on their website. The analysis
Make a Vertical AND Horizontal analysis for the company "DEUTSCHE LUFTHANSA AG." You can find their financial reports online or on their website.
The analysis needs to be for 3-5 years.
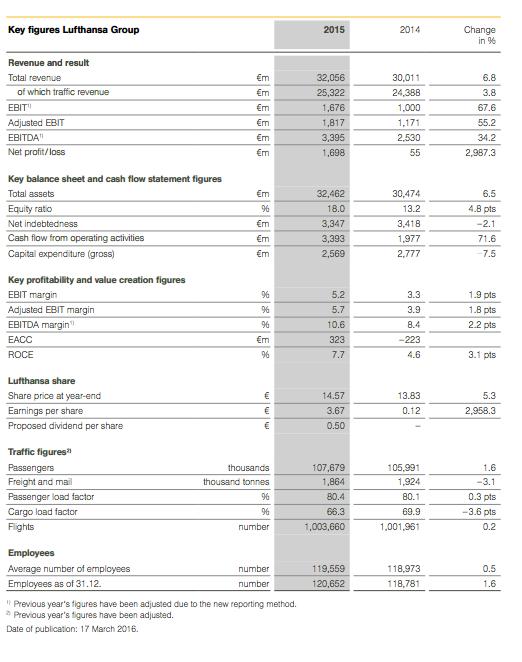
Key figures Lufthansa Group Revenue and result Total revenue of which traffic revenue EBIT" Adjusted EBIT EBITDA" Net profit/loss Key balance sheet and cash flow statement figures Total assets Equity ratio Net indebtedness Cash flow from operating activities Capital expenditure (gross) Key profitability and value creation figures EBIT margin Adjusted EBIT margin EBITDA margin" EACC ROCE Lufthansa share Share price at year-end Earnings per share Proposed dividend per share Traffic figures" Passengers Freight and mail Passenger load factor Cargo load factor Flights Employees Average number of employees Employees as of 31.12. m 555555 m m m m m 96 m m m **** m 96 www thousands thousand tonnes 96 %6 number number number "Previous year's figures have been adjusted due to the new reporting method. Previous year's figures have been adjusted. Date of publication: 17 March 2016. 2015 32,056 25,322 1,676 1,817 3,395 1,698 32,462 18.0 3,347 3,393 2,569 5.2 5.7 10.6 323 7.7 14.57 3.67 0.50 107,679 1,864 80.4 66.3 1,003,660 119,559 120,652 2014 30,011 24,388 1,000 1,171 2,530 55 30,474 13.2 3,418 1,977 2,777 3.3 3.9 8.4 -223 4.6 13.83 0.12 105,991 1,924 80.1 69.9 1,001,961 118,973 118,781 Change in % 6.8 3.8 67.6 55.2 34.2 2,987.3 6.5 4.8 pts -2.1 71.6 7.5 1.9 pts 1.8 pts 2.2 pts 3.1 pts 5.3 2,958.3 1.6 -3.1 0.3 pts -3.6 pts 0.2 0.5 1.6
Step by Step Solution
3.46 Rating (153 Votes )
There are 3 Steps involved in it
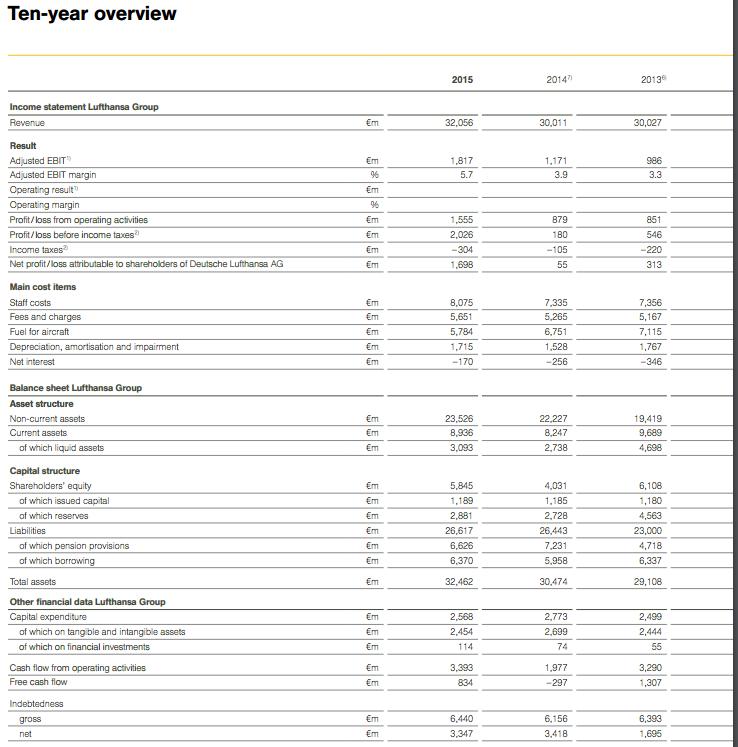
Answer Key figures Lufthansa Group 2015 2014 2013 Income Statement Lufthansa Group Revenue 32056 109 ... View full answer

Get step-by-step solutions from verified subject matter experts