Question: Make an analytics portfolio For your life-long learning, and development and display of skills, you are free to design the analytics portfolio in whatever way
Make an analytics portfolio
For your life-long learning, and development and display of skills, you are free to design the analytics portfolio in whatever way that suits you. However, for the examination in the course, your portfolio must include:
- A first page containing:
- A summary statement of what you want to show (approx 150 words)
- A matrix mapping the Examples you include to the Intended Learning Outcomes
- One example showing your best analytical skills. This should be something you are really proud of. Approximately 800 words.
- One example showing how you have developed and learned through practice. This part should include a short summary of the analysis/task you were working on, but should mostly consist of a reflection on your process, potential failures, and learning from doing the task. Approximately 800 words.
If you include more than these two examples, please clearly specify which two you want us to base our evaluation on.
Grading is based on the structure of the analytical approach (use the diamond model!, you find it in the article under), the clarity of communication, the level of analytical ambition, the use of theory and literature, and the reflective maturity showed.
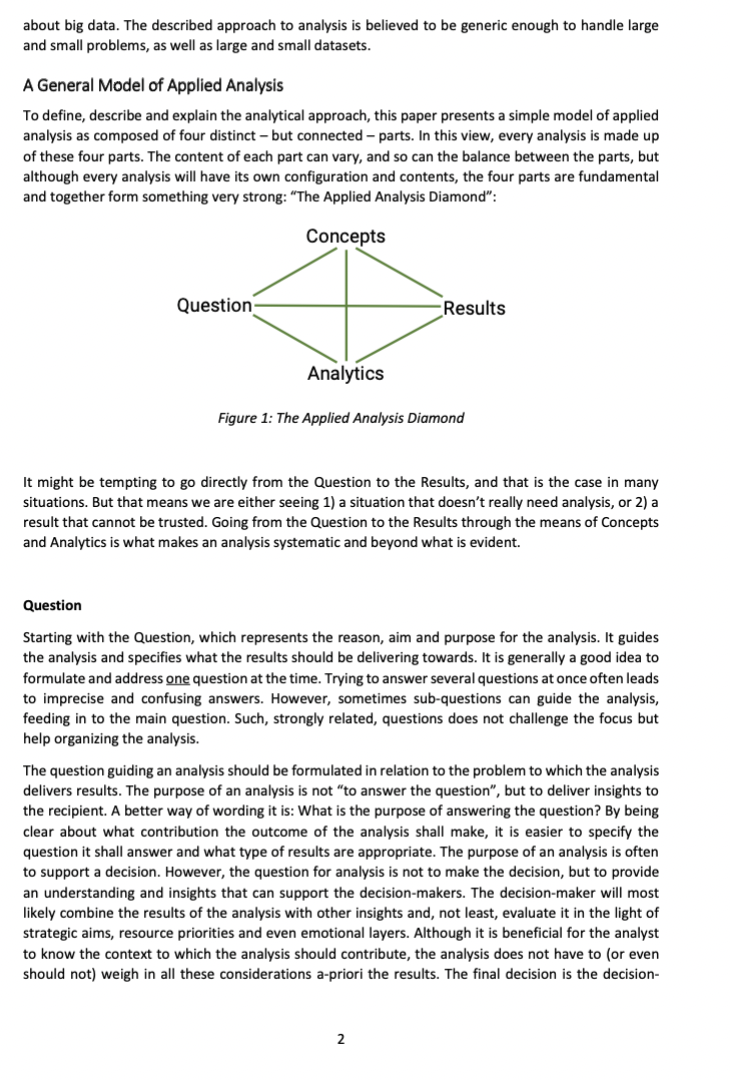
Introduction We constantly make decisions, and perform analyses to support the decision-making. But this is often made implicitly, without a structured and formalized process, and often without even thinking of it. To not over-complicate our lives, some decisions and analyses are best handled through routine, experience, instinct ("gut feeling) or randomness. But some are not. A systematic approach to analysis is necessary to ensure accountability: the process can be followed, assumptions are specified, and the results can be trusted. This is a key difference between your own, personal decisions, and your role as a professional analyst and decision-maker. Throughout the paper, the word "analysis denotes the process of structured thinking and processing information) in order to support understanding and/or decision-making!. Understanding your own analytical thinking can help you understand and trust your thought-process and, hopefully, allow you to help other decision-makers through solid analyses. The limits of human thinking have been researched and described by, for example, Daniel Kahneman (see course literature). This text does not problematize the process of thinking, but focus on outlining a structured way to handle our limitations. The paper builds on the view that the value of data comes from the use of it to gain insights and support understanding. Furthermore, the use of data is contextually dependent, implying a relational view of data? Fulfilling its purpose requires that the analysis relies on suitable conceptual and methodological approaches, and therein lies the fundamental challenge for analysts. This paper aims to help in the development of an analytical mindset. It does so by defining the basic parts of applied analysis. The structured approach to analysis helps you think like an analyst. It should be said that the focus of this text, and model, is applied analysis within the social sciences, or if you will: everyday situations in society and business. It might not be applicable to some areas, where domain-specific views of analysis prevail, often very technical, such as chemical analysis and statistical analysis. Looking ahead, there is no doubt that analytical capability will be a key competence in the job market. Moreover, in the surge of the availability of, talk about and expectations around Big Data, analysts face a huge challenge. They are expected to apply their analytical skills on a dataset that is described (with emphasis) as very different from "traditional" data. This makes big data analysis very challenging. Knowledge, skills and routines acquired through training and experience might not be directly applicable. Still, managers are likely having high expectations, based on the many success stories told about big data. The described approach to analysis is believed to be generic enough to handle large and small problems, as well as large and small datasets. A General Model of Applied Analysis To define, describe and explain the analytical approach, this paper presents a simple model of applied analysis as composed of four distinct - but connected -parts. In this view, every analysis is made up of these four parts. The content of each part can vary, and so can the balance between the parts, but although every analysis will have its own configuration and contents, the four parts are fundamental and together form something very strong: "The Applied Analysis Diamond": Concepts Question Results Analytics Figure 1: The Applied Analysis Diamond It might be tempting to go directly from the Question to the results, and that is the case in many situations. But that means we are either seeing 1) a situation that doesn't really need analysis, or 2) a result that cannot be trusted. Going from the Question to the Results through the means of Concepts and Analytics is what makes an analysis systematic and beyond what is evident. Question Starting with the Question, which represents the reason, aim and purpose for the analysis. It guides the analysis and specifies what the results should be delivering towards. It is generally a good idea to formulate and address one question at the time. Trying to answer several questions at once often leads to imprecise and confusing answers. However, sometimes sub-questions can guide the analysis, feeding in to the main question. Such, strongly related, questions does not challenge the focus but help organizing the analysis. The question guiding an analysis should be formulated in relation to the problem to which the analysis delivers results. The purpose of an analysis is not "to answer the question", but to deliver insights to the recipient. A better way of wording it is: What is the purpose of answering the question? By being clear about what contribution the outcome of the analysis shall make, it is easier to specify the question it shall answer and what type of results are appropriate. The purpose of an analysis is often to support a decision. However, the question for analysis is not to make the decision, but to provide an understanding and insights that can support the decision-makers. The decision-maker will most likely combine the results of the analysis with other insights and, not least, evaluate it in the light of strategic aims, resource priorities and even emotional layers. Although it is beneficial for the analyst to know the context to which the analysis should contribute, the analysis does not have to (or even should not) weigh in all these considerations a-priori the results. The final decision is the decision- 2 maker's task, not the analysts'. The separation between the purpose (close to the problem or issue that the recipient faces) and the question (delimiting and guiding the analyst) is very important for making the analysis manageable and the expectations reasonable. The separation between the question and the purpose means that in most cases, several different questions could fulfil the same purpose. An analyst must be able to formulate a question that will fulfil the purpose, satisfy the recipient's needs, and be within the scope of the available analytical competence, tools and data. What can be challenging is that there is often not an evident (and simple) question when the problem is complex. In terms of the process, the more precise the question is, the more clear guidance is offered to the other parts. But in many cases, especially with equivocal questions, this has to be revised throughout the analysis. Regarding the question as an integrated rather than a priori part of the analysis could potentially increase the use and value of available data. A common type of question is about creating comparability, either between two or more options, or to an ideal. Such an ideal can, for example, be theoretically defined, a best-case scenario, a strategic aim or an operational target. The resulting comparison can then support the decision-making. Another type of question focuses on reducing complexity. In an unfamiliar situation, rich information, or the first chaotic moments after a big incident, the analysis can aim to find the key concepts, the core actors, or outline the road ahead, among other things. Concepts The Concepts denote the conceptual approach that makes the analysis "smart". It is an intellectual tool which implies the identification of the core aspects to make the focus and perspectives clear and distinct. In abstract terms, this would be a conceptual model. Research may talk about theory, other areas may specify key performance indicators or prioritized areas. The point is to create a line of reasoning that helps making the analysis stringent. It specifies what the analytics should use data to address. Perhaps with the exception of the simplest ones, the answer to most questions is "it depends". This is what the Concepts help us handle. It defines which perspective is taken, what parts are relevant to include, and which assumptions are made. In many of the courses you will take during your university studies you will learn about different conceptual models. For example explaining how a company can manage its marketing, evaluate investments, choose direction of international expansion, etc. (What is described in this text is a conceptual model of the basics of applied analysis.) Such "theories" or "models" are proposed concepts, argued by the authors to give a good understanding of the phenomenon at hand. They each offer a way to approach a question. Analytics The third part of the diamond is the Analytics, i.e. the use of tools, methods and procedures to extract meaning from data. In some occations, this might actually be what is intended with "analysis", but that is as you now know only part of it. It is, however, what makes analysis sometimes seems advanced and technical. Although this part can sometimes be confused with the wider term analysis, Analytics here denotes the use of data to create Results that answers the Question based on the defined Concepts. Basically, it uses the smart thinking from the concepts and applies it to data to extract knowledge and insights. The analysis is thus assumed to be based on some sort of data. Basically, data is some sort of systematically recorded information. It can originate from empirical observation, experiments or simulations. It can be in many different forms (numbers, texts, pictures, sound and videos) and be 3 collected from many different sources. In some situations, the analysis uses existing data, perhaps collected for another purpose. In those cases, the analytics must make use of available data without violating its definitions and limitations. If no data exists, data collection becomes an important part of the analytics. The collection of good quality data is a valuable skill, which must balance relevance, validity and resources. Data collection methods include, for example, interviews, focus groups, experiments, questionnaires, sensors, secondary sources, open data and web-scraping. Depending on the question and concept, but also the data, Analytics could involve the use of qualitative or quantitative methods, and manual as well as software tools. The availability of computer software to perform analytics should be approached with caution. Some programs make it easy to perform advanced analytics, but the analyst is responsible for having a (sufficient) understanding of what is actually happening. The analytics can have an exploratory or confirmatory approach, and be descriptive, predictive or prescriptive. The different methods aims to, for example, look for patterns in the data, reduce overwhelming numbers of observations or dimensions, find relationships and links between observations or dimensions, rank importance, or describe processes. Most analytic methods produces some form of output, which the analyst must interpret and evaluate. This is where the link to the Concepts is helpful. Interpreting the outcome of analytics relies on the guidance from the Question and Concepts. However, the analytics can also feed back through interative process, where the question and concepts are revised based on possibilities or limitations seen through the analytics. Results The Results part of the analysis concerns the delivery and presentation of the findings; answering the questions, fulfilling the aim and delivering value. Results can take many different forms, for example, written reports, lists, visualizations, recommendations or automatic actions, much depending on the recipient and aim. The importance of adapting the communication of the Results to the situation cannot be over-stated. If the analysis should simplify things, that is what it must do. Little room for interpretation should be left to the recipient. The analyst knows the assumptions, definitions and limitations of the results, and interpretations violating these could be harmful. Answering the question, and doing so in a way that helps fulfilling the purpose, is what makes the analysis (and analyst) useful. If the analysis shall support the choice between several options, the results must support that choice and, if possible, propose a ranking of the options. If the analysis is aimed at providing an understanding for current issues in an area, the results could be presented in a way that gives a relatively rich understanding of what has been revealed. Visualizing results is a large field, with many exciting tools available, especially for quantitative analysis. Visualization of data should, however, be used with caution. It can be tempting to regard a very impressive visualization as the results, but visualizations of data without a strong connection to the question, concepts and analytics is more likely art than analysis. In general, every visualization needs to be explained and interpreted by the analyst - it is not up to the receiver to interpret data. Whether the results are in the form of graphs or words, they are part of a story. A skilled analyst can perform a sophisticated analysis and transform even the most complex outcome into insights for the receiver. Most numbers, words and images can be interpreted in different ways. The analyst's Story- telling" is needed not just for pedagogical reasons, but also to ensure that the results are interpreted in line with the analyst's argumentation - and within the limitations of the analysis. Reading more into the results than have been shown, extrapolating beyond what have been studied, generalizing to other situations, and redefining concepts can risk making your analysis the foundation of "alternative facts". 4 Different domains can have different "formats" in which results are presented. A "business case" is a presentation where a business proposition is suggested by showing costs and benefits, both quantitatively and qualitatively, to support decision-makers in assessing the proposition. It thus "dresses" the analysis of costs and benefits in the business terminology, and explicitly relates the outcome to the stakeholders' context of strategies, resource efficiency and profitability. Another example is "persona analysis, which presents the reduction of variance achieved through cluster analysis in the form of fictitious individuals. This can be used to highlight different customers, users or employees, without the need to individualize, which is helpful in, for example, product development and customer interaction. Designing vs Doing Analysis In some situations, the analyst will be performing standardized analysis where the design of the Applied Analysis Diamond is a priori defined. This is often the case when a form of analysis is carried out repeatedly, and consistency as well as comparability is desired. The design of the analysis is developed and refined over time, and is an analysis product endorsed by the organization. In this type of analysis, the Question (and purpose) is specified and generally not subject to discussion. The Concepts define the organization's perspective and emphasis, and make sure the same language" is spoken within the organization, and between analysts. The Analytics have been proven successful, compatible with the data type, and perhaps even automated through investments in tools and algorithms. Finally, the format of the Results is specified in the form of a report template, master slide show, dashboard design or key performance indicators. What remains the challenge for the analyst is to perform the analysis in line with the design, employing analytics and concepts correctly, and reporting as expected. What differs from time to time is likely the data. The analyst must ensure the relevant and reliable data is used, and that it is in an appropriate format. Examples of standardized analysis are product function tests, recruitment profiling, and investment appraisals. Doing analysis with a standardized design is not necessarily simple if so, it is likely to be automated). Major decisions can depend on the outcome and the standardized analysis is the organization's quality assurance. The systematic procedure is of utmost importance to the analyst: the result of the analysis can be wrong, but not because the analyst has done wrong. Whereas standardized analysis (doing analysis) is often a task for junior or assistant positions, the responsibility for designing analysis is generally associated with more senior roles. Balancing the four parts of the diamond requires a good understanding of the context, including the purpose and the recipient's wider considerations which influences the Question, and appropriate communication skills to design the Results. Furthermore, the intellectual ability to conceptualize must be combined with domain-specific knowledge to create useful Concepts. Profound skills in Analytics often require both technical knowledge of the methods used, and an understanding of the assumptions and limitations within which the Results are valid. Needless to say, the design of more complex analysis is likely to be team effort. 5


