

Question: make an appendix like this for Case study tesla entry into U.S. auto industry Ratios Type of Ratio Profitability Ratio Profitability Ratio Profitability Operating OPM
make an appendix like this for Case study tesla entry into U.S. auto industry 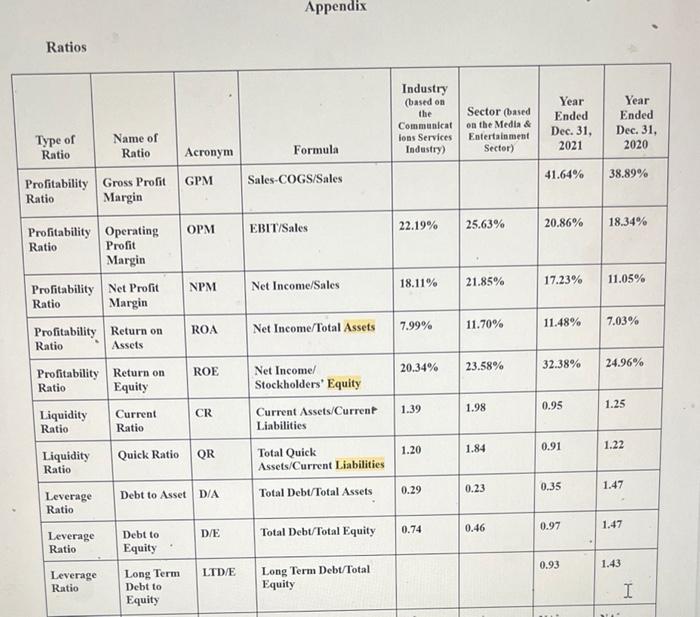
Ratios Type of Ratio Profitability Ratio Profitability Ratio Profitability Operating OPM Ratio Profit Margin Liquidity Ratio Profitability Return on Ratio Assets Liquidity Ratio Name of Ratio. Profitability Return on Ratio Equity Leverage Ratio Gross Profit Margin Leverage Ratio Leverage Ratio Net Profit Margin Current Ratio Quick Ratio. Acronym GPM Debt to Equity Long Term Debt to Equity NPM ROA ROE CR Debt to Asset D/A QR D/E LTD/E Appendix Formula Sales-COGS/Sales EBIT/Sales Net Income/Sales Net Income/Total Assets Net Income/ Stockholders' Equity Current Assets/Current Liabilities Total Quick Assets/Current Liabilities Total Debt/Total Assets Total Debt/Total Equity Long Term Debt/Total Equity Industry (based on the Communicat ions Services Industry) 22.19% 18.11% 7.99% 20.34% 1.39 1.20 0.29 0.74 Sector (based on the Media & Entertainment Sector) 25.63% 21.85% 11.70% 23.58% 1.98 1.84 0.23 0.46 Year Ended Dec. 31, 2021 41.64% 20.86% 17.23% 11.48% 0.95 0.91 0.35 0.97 0.93 Year Ended Dec. 31, 2020 32.38% 24.96% 38.89% 18.34% 11.05% 7.03% 1.25 1.22 1.47 1.47 1.43 MU I Ratios Type of Ratio Profitability Ratio Profitability Ratio Profitability Operating OPM Ratio Profit Margin Liquidity Ratio Profitability Return on Ratio Assets Liquidity Ratio Name of Ratio. Profitability Return on Ratio Equity Leverage Ratio Gross Profit Margin Leverage Ratio Leverage Ratio Net Profit Margin Current Ratio Quick Ratio. Acronym GPM Debt to Equity Long Term Debt to Equity NPM ROA ROE CR Debt to Asset D/A QR D/E LTD/E Appendix Formula Sales-COGS/Sales EBIT/Sales Net Income/Sales Net Income/Total Assets Net Income/ Stockholders' Equity Current Assets/Current Liabilities Total Quick Assets/Current Liabilities Total Debt/Total Assets Total Debt/Total Equity Long Term Debt/Total Equity Industry (based on the Communicat ions Services Industry) 22.19% 18.11% 7.99% 20.34% 1.39 1.20 0.29 0.74 Sector (based on the Media & Entertainment Sector) 25.63% 21.85% 11.70% 23.58% 1.98 1.84 0.23 0.46 Year Ended Dec. 31, 2021 41.64% 20.86% 17.23% 11.48% 0.95 0.91 0.35 0.97 0.93 Year Ended Dec. 31, 2020 32.38% 24.96% 38.89% 18.34% 11.05% 7.03% 1.25 1.22 1.47 1.47 1.43 MU Step by Step Solution
There are 3 Steps involved in it
1 Expert Approved Answer
Step: 1 Unlock

Question Has Been Solved by an Expert!
Get step-by-step solutions from verified subject matter experts
Step: 2 Unlock
Step: 3 Unlock