

Question: Make plot of the electromagnetic spectrum using Python (provide code). Label Frequency Your end product should look something like this: Frequency (Hz) 1MHz. 106 107
Make plot of the electromagnetic spectrum using Python (provide code).
Label Frequency
Your end product should look something like this:
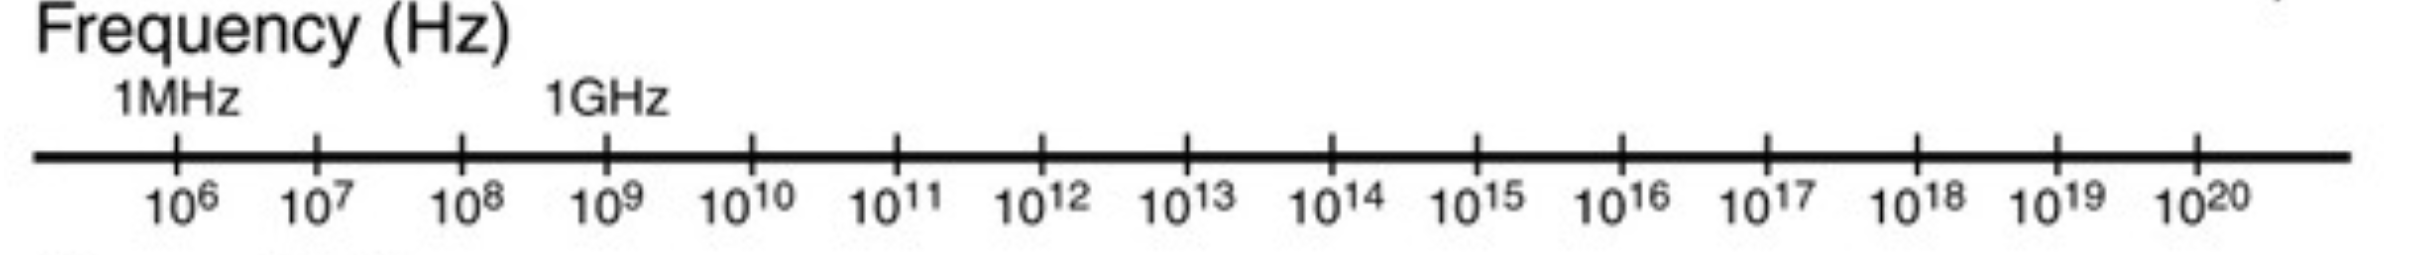
Frequency (Hz) 1MHz. 106 107 108 O2 109 1010 + + + + + tet 1011 1012 1013 1014 1015 1016 1017 1018 1019 1020 18 1019 1020 Frequency (Hz) 1MHz. 106 107 108 O2 109 1010 + + + + + tet 1011 1012 1013 1014 1015 1016 1017 1018 1019 1020 18 1019 1020
Step by Step Solution
There are 3 Steps involved in it
1 Expert Approved Answer
Step: 1 Unlock

Question Has Been Solved by an Expert!
Get step-by-step solutions from verified subject matter experts
Step: 2 Unlock
Step: 3 Unlock