

Question: Make plot of the electromagnetic spectrum using Python. - Label frequency, wavelength, and eV. - Label the various regions of the spectrum. Your end product
Make plot of the electromagnetic spectrum using Python.
- Label frequency, wavelength, and eV.
- Label the various regions of the spectrum.
Your end product should look something like this:
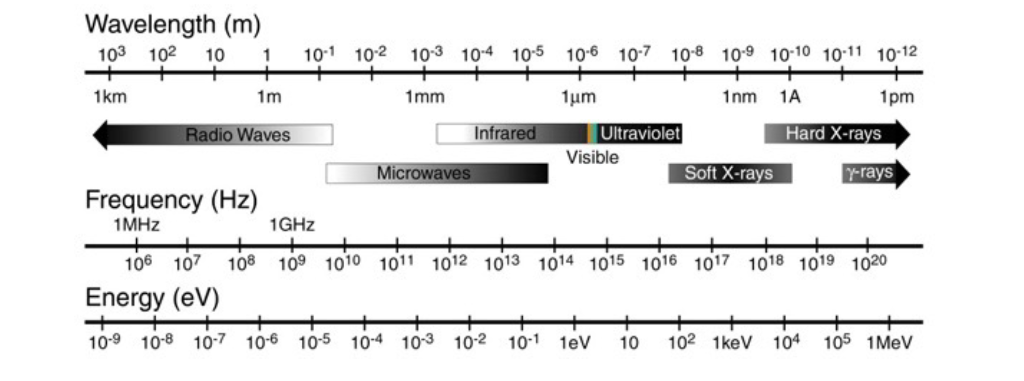
Wavelength (m) 103 102 101 101 102 103 104 105 106 107 108 10-9 10-10 10-11 10-12 1km 1m 1mm 1m 1nm 1A 1pm Radio Waves Infrared Hard X-rays Ultraviolet Visible Soft X-rays Microwaves r-rays Frequency (Hz) 1MHz 1GHz 106 107 108 109 1010 1011 1012 1013 1014 1015 1016 1017 1018 1019 1020 Energy (ev) 10-9 10-8 107 10-6 10-5 10-4 10-3 10-2 101 lev 10 102 1kev 104 105 1Mev Wavelength (m) 103 102 101 101 102 103 104 105 106 107 108 10-9 10-10 10-11 10-12 1km 1m 1mm 1m 1nm 1A 1pm Radio Waves Infrared Hard X-rays Ultraviolet Visible Soft X-rays Microwaves r-rays Frequency (Hz) 1MHz 1GHz 106 107 108 109 1010 1011 1012 1013 1014 1015 1016 1017 1018 1019 1020 Energy (ev) 10-9 10-8 107 10-6 10-5 10-4 10-3 10-2 101 lev 10 102 1kev 104 105 1Mev
Step by Step Solution
There are 3 Steps involved in it

Get step-by-step solutions from verified subject matter experts