

Question: MAKE two frequency tables based on two separate questions from your survey. MAKE bar graph and a pie chart based on the data in the
- MAKE two frequency tables based on two separate questions from your survey.
- MAKE bar graph and a pie chart based on the data in the frequency tables.
- Determine the class intervals and create frequency distribution for each of the frequency tables.
- Create one frequency polygon of the data from the frequency distribution.
Conduct an analysis of your project data. Prepare the items below based on the data from two of the variables in the data collection instrument.
- Determine the mean, median, and mode for each of the variables.
- What is the variance for each set of data for each of the variables?
- What is the standard deviation for each of the variables?
- What is the probability that each event occurs in each of the two variables.
Create confidence intervals related to the interval and ratio-level data you collected.
- What is the best estimate of the population mean
- Develop a 95% confidence interval for the population mean. Develop a 90% confidence interval for the population mean. Develop a 98% confidence interval for the population mean.
- Interpret the confidence interval.
Conduct an analysis and hypothesis test of your choice on the data you collected. Create
word research summary of the findings generated in the assignments for Topics 2 through 5. make summary should address the following.
- Explain what type of analysis and hypothesis test was conducted on the data collected.
- Summarize the survey results based on the results of the data you analyzed.
- Include the Excel analysis as part of the documents
A topic need to be pick before questions can be answered
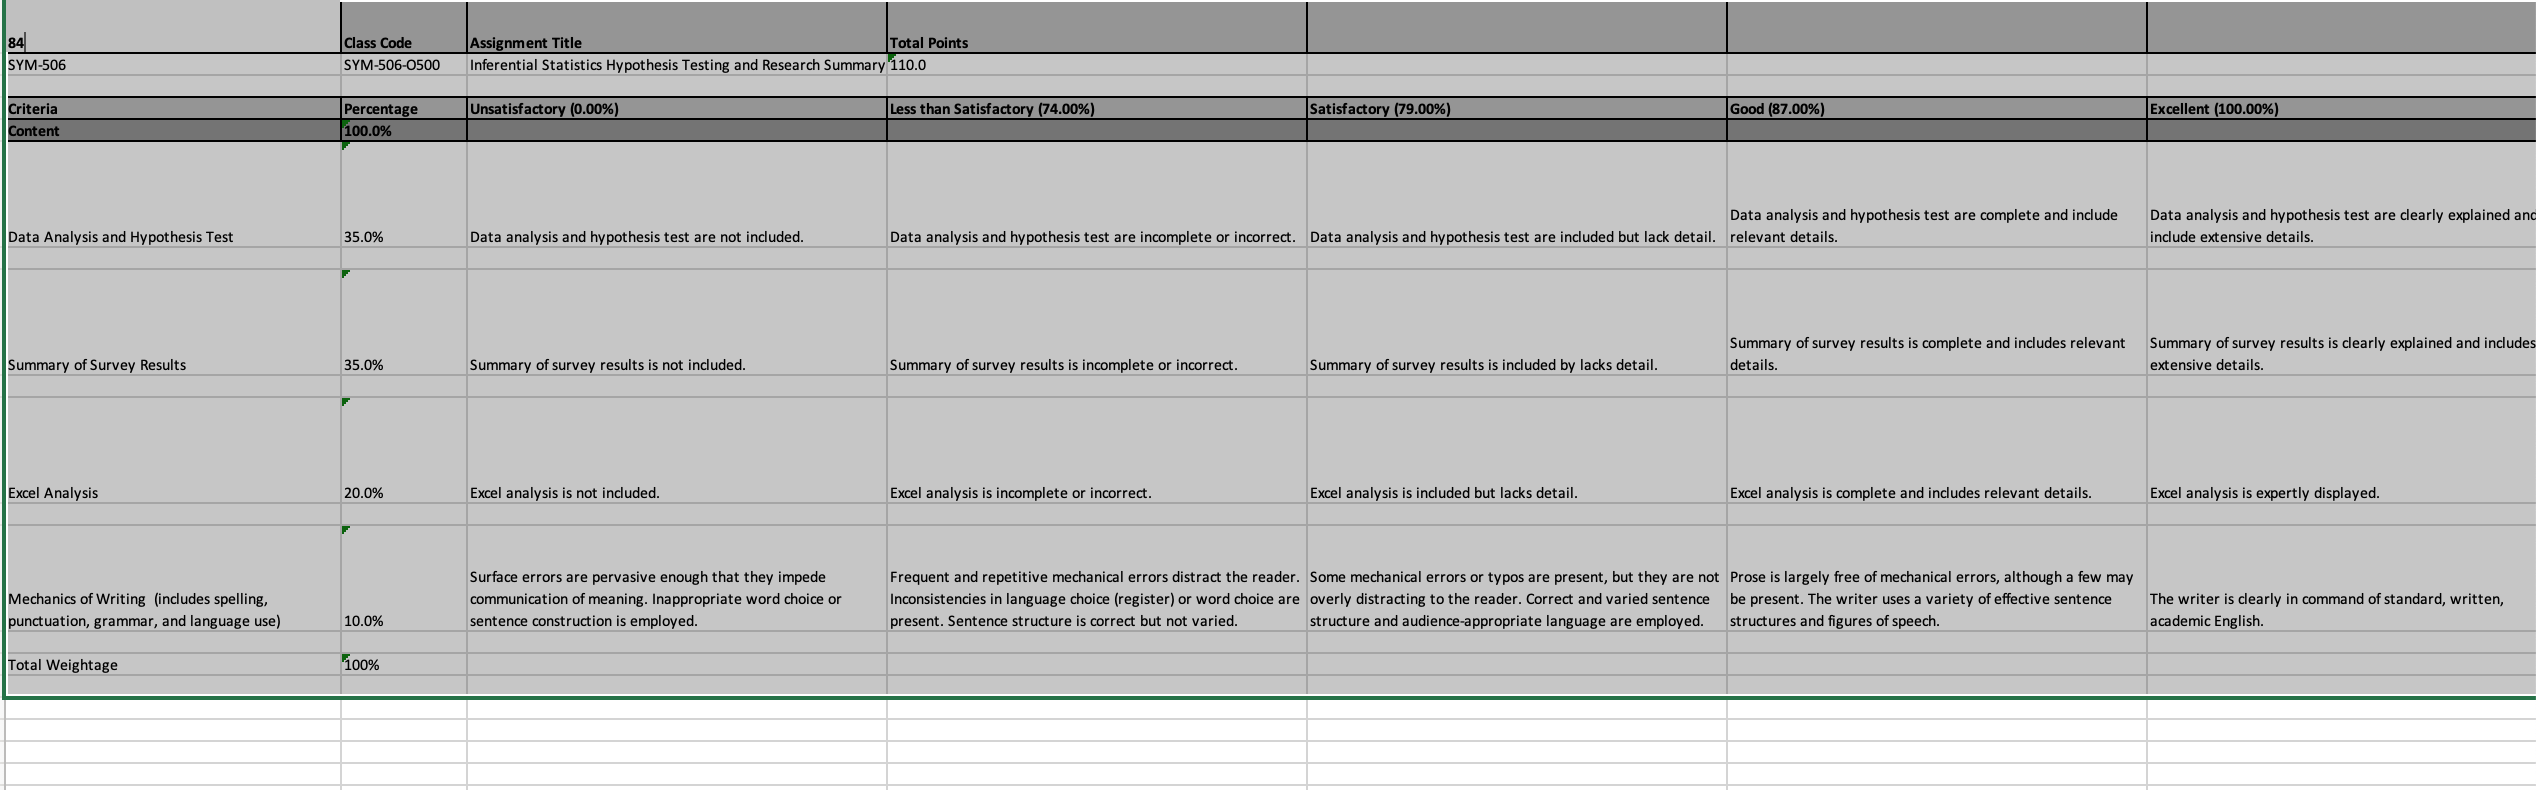
84 Class Code Assignment Title Total Points SYM-506 SYM-506-0500 Inferential Statistics Hypothesis Testing and Research Summary 110.0 Criteria Percentage Unsatisfactory (0.00%) Less than Satisfactory (74.00%) Satisfactory (79.00%) Good (87.00%) Excellent (100.00%) Content 100.0% Data Analysis and Hypothesis Test 35.0% Data analysis and hypothesis test are not included. Data analysis and hypothesis test are incomplete or incorrect. Data analysis and hypothesis test are included but lack detail. relevant details. Data analysis and hypothesis test are complete and include Data analysis and hypothesis test are clearly explained an include extensive details. Summary of Survey Results 35.0% Summary of survey results is complete and includes relevant Summary of survey results is not included. Summary of survey results is incomplete or incorrect. Summary of survey results is clearly explained and include Summary of survey results is included by lacks detail. details extensive details. Excel Analysis 20.0% Excel analysis is not included. Excel analysis is incomplete or incorrect. Excel analysis is included but lacks detail. Excel analysis is complete and includes relevant details. Excel analysis is expertly displayed. Surface errors are pervasive enough that they impede Mechanics of Writing (includes spelling, Frequent and repetitive mechanical errors distract the reader. Some mechanical errors or typos are present, but they are not Prose is largely free of mechanical errors, although a few may communication of meaning. Inappropriate word choice or Inconsistencies in language choice (register) or word choice are overly distracting to the reader. Correct and varied sentence punctuation, grammar, and language use) 10.0% sentence construction is employed. present. Sentence structure is correct but not varied. structure and audience-appropriate language are employed. be present. The writer uses a variety of effective sentence The writer is clearly in command of standard, written, structures and figures of speech. academic English. Total Weightage 100%
Step by Step Solution
There are 3 Steps involved in it

Get step-by-step solutions from verified subject matter experts