

Question: Make up a set of data for which the mean is greater than the median. Plot the data for each of the three conditions in
- Make up a set of data for which the mean is greater than the median.
- Plot the data for each of the three conditions in Table 4.2 and describe the results.
- Create a sample of 10 numbers that has a mean of 8.6. Notice carefully how you did this?it will help you later to understand the concept of degrees of freedom.
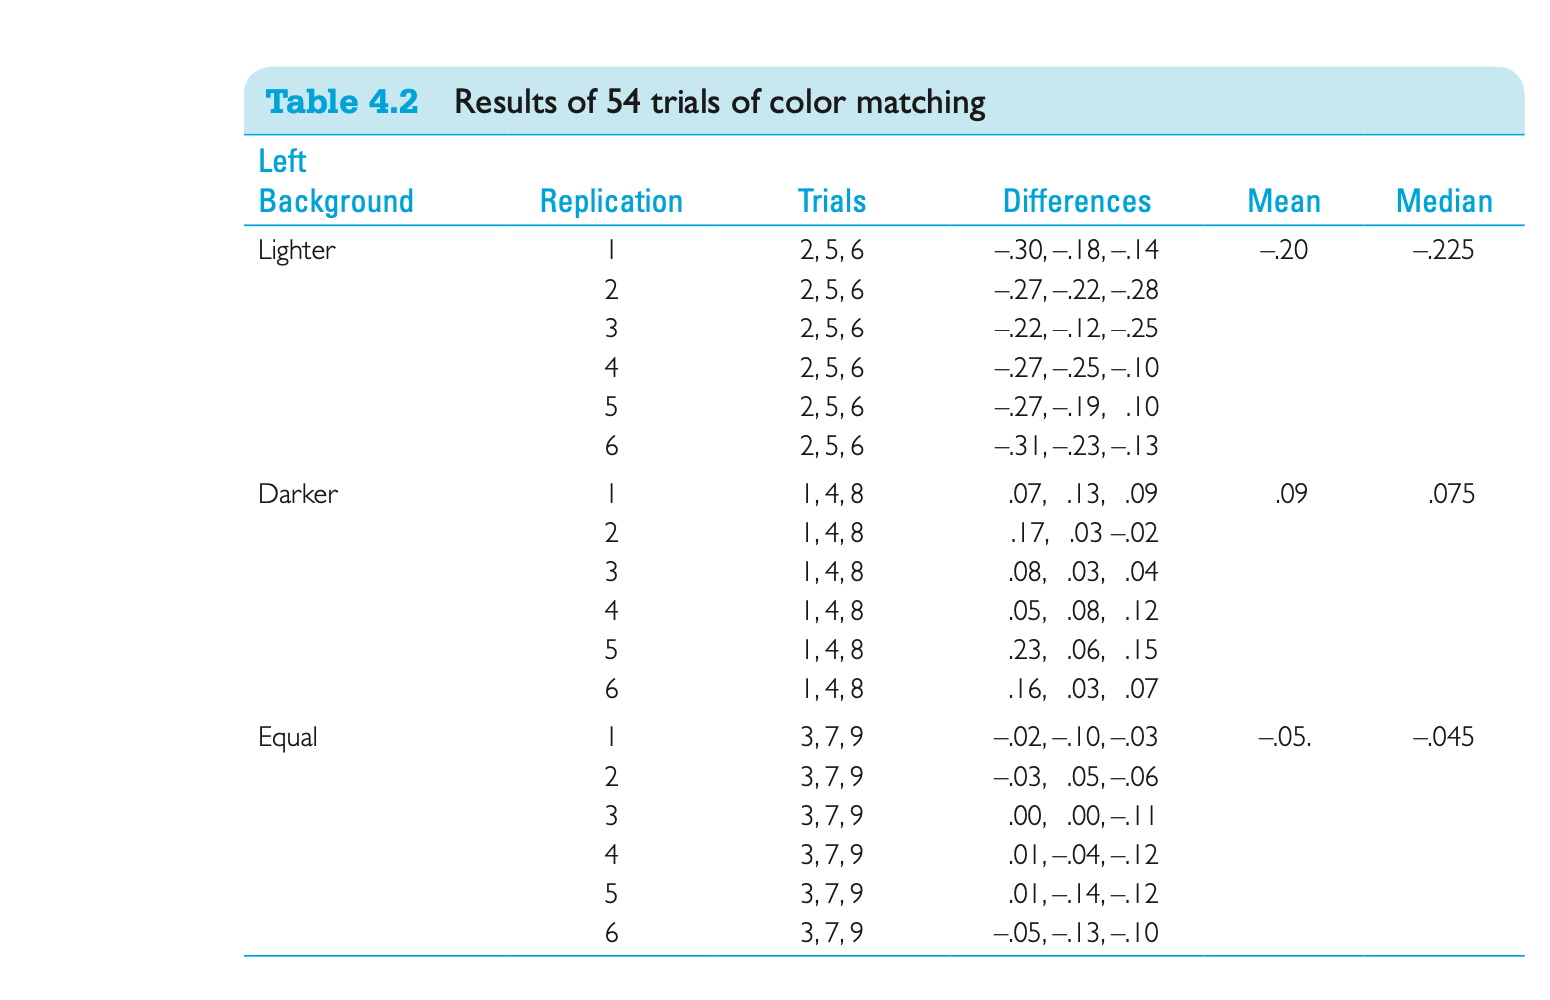
Table 4.2 Results of 54 trials of color matching Left Background Replication Trials Differences Mean Median Lighter 2 , 5 , 6 -.30, -.18, -.14 -.20 -.225 2, 5, 6 -.27, -.22, -.28 2, 5, 6 -.22, -.12, -.25 2, 5, 6 -.27,-.25, -.10 2 , 5, 6 -.27, -.19, .10 2 , 5, 6 -.31,-.23,-.13 Darker 1, 4, 8 07, .13, .09 09 075 1, 4, 8 17, .03 -.02 1, 4, 8 08, .03, .04 Q UA W N - Q UA W N - OUTAWN- 1, 4, 8 05, .08, .12 1, 4, 8 23, .06, .15 1 , 4, 8 . 16, .03, .07 Equal 3 , 7,9 -.02, -.10, -.03 .05. -.045 3, 7,9 -.03, .05, -.06 3, 7, 9 .00, .00, -.1 1 3, 7,9 .01, -.04, -. 12 3 , 7,9 .01, -.14, -.12 3, 7,9 -.05, -.13, -.10
Step by Step Solution
There are 3 Steps involved in it
1 Expert Approved Answer
Step: 1 Unlock

Question Has Been Solved by an Expert!
Get step-by-step solutions from verified subject matter experts
Step: 2 Unlock
Step: 3 Unlock