

Question: Make your own graph applying the Multi-Objective Optimization (please show the graph in a piece of paper) Pick your own topic and put it in
Make your own graph applying the Multi-Objective Optimization (please show the graph in a piece of paper)
Pick your own topic and put it in a power point presentation or PDF, whether it is about buying things, creating a certain product, making food, etc.
Example of the graph:
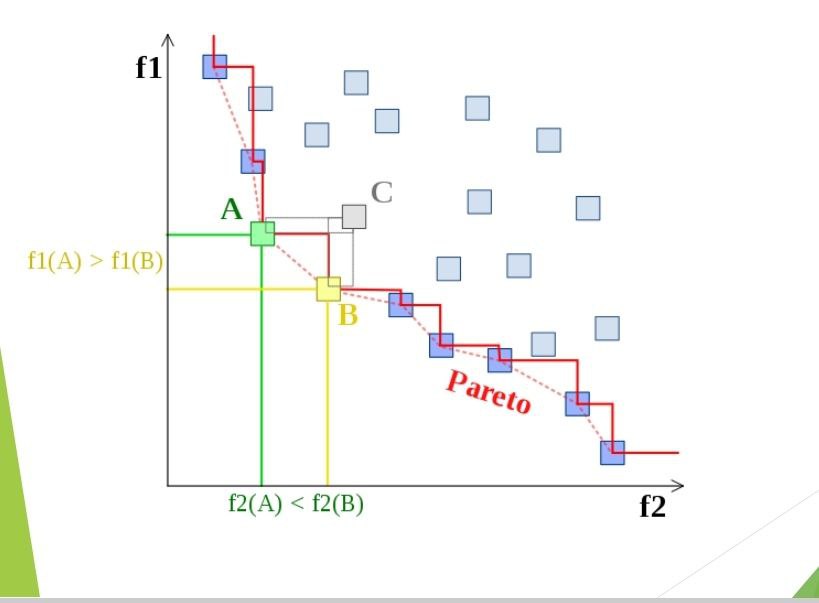
f1 f1(A) > f1(B) A C B Pareto f2(A) < f2(B) f2
Step by Step Solution
There are 3 Steps involved in it
1 Expert Approved Answer
Step: 1 Unlock

Pareto front showing the tradeoff between high perform... View full answer
Question Has Been Solved by an Expert!
Get step-by-step solutions from verified subject matter experts
Step: 2 Unlock
Step: 3 Unlock