Question: please answer question 8 Section 2: Pearson Correlation (Ch. 14 - 14 half Your job in this section will be to find the variables that
please answer question 8
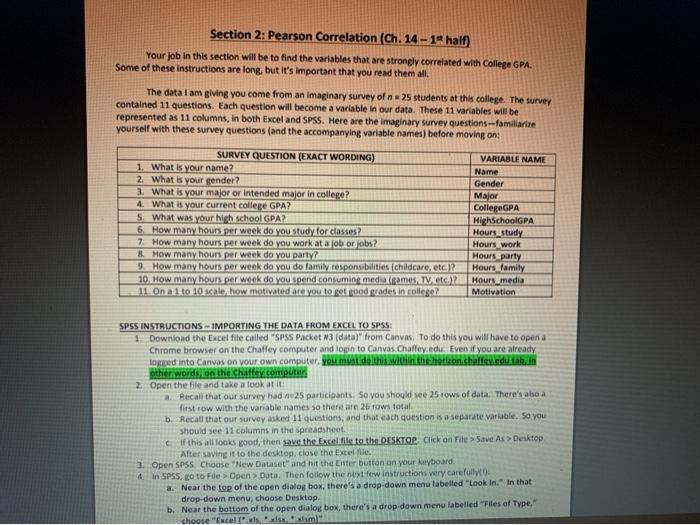
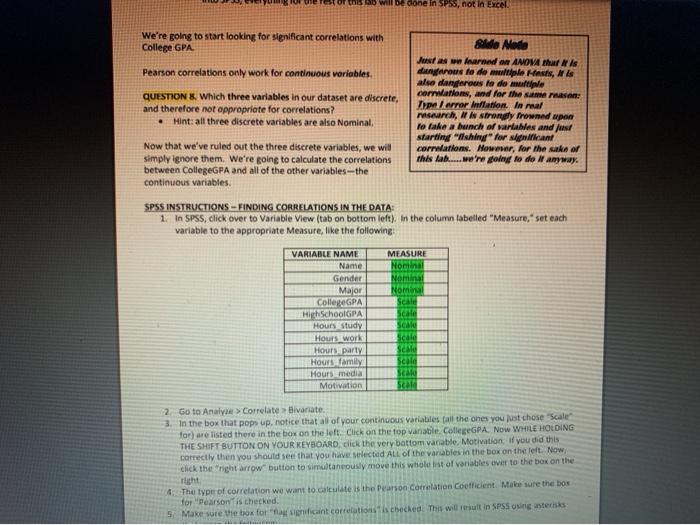
Section 2: Pearson Correlation (Ch. 14 - 14 half Your job in this section will be to find the variables that are strongly correlated with College GPA Some of these instructions are long, but it's important that you read them all The data I am giving you come from an imaginary survey of 25 students at this college. The survey contained 11 questions. Each question will become a variable in our data. These 11 variables will be represented as 11 columns, in both Excel and SPSS. Here are the imaginary survey questions--familiarize yourself with these survey questions (and the accompanying variable names) before moving on: SURVEY QUESTION (EXACT WORDING) 1. What is your name? 2. What is your gender? 3. What is your major or intended major in college? 4. What is your current college GPA? S. What was your high school GPA? 6. How many hours per week do you study for classes? 7. How many hours per week do you work at a job or jobs? & How many hours per week do you party? 9. How many hours per week do you do family responsibilities (Childcare, etc. 12 10. How many hours per week do you spend consuming media games TV etc.)? 11. Ona 1 to 10 scale, how motivated are you to get good grades in college? VARIABLE NAME Name Gender Major College GPA HighschoolGPA Hours study Hours work Hours party Hours family Hours_media Motivation SPSS INSTRUCTIONS IMPORTING THE DATA FROM EXCEL TO SPSS 1 Download the Excel file called "SPSS Packet 3 (data)" from Canvas. To do this you will have to open a Chrome browser on the Chaffey computer and login to Canvas. Chaffey.edu. Even if you are already logged into Canvas on your own computer. You do this within the horizon.challey.edu tak in other words on the Chaffey computer 2 Open the file and take a look at it 2 Recall that our survey had n 25 participants. So you should see 25 rows of data. There's aboa first row with the variable names so there are 2 rows total b. Recall that our survey asked 11 questions, and that each question is a separate variable, so you should see 11 columns in the spreadsheet If this all looks good, then save the Excel file to the DESKTOP Click on File > Save As > Desktop After saving it to the desktop, close the Excel 1. Open SPSS Choose "New Dataset" and hit the Enter button on your keyboard 4. In SPSS, o to File > Open Data. Then fotlow the xt few instructions very carefully a. Near the top of the open dialog box, there's a drop-down menu labelled "Look In. In that drop-down menu, choose Desktop b. Near the bottom of the open dialog box, there's a drop down menu labelled "Files of Type. choose "Excelsiswym of this will be SPSS, not in Excel We're going to start looking for significant correlations with College GPA Pearson correlations only work for continuous variables QUESTION & Which three variables in our dataset are discrete, and therefore not appropriate for correlations? Hint: all three discrete variables are also Nominal &ldo Mode us warn ANOVA turis dunerous fe de multiple Hest, also dangerous te de multiple carnations, and for the reason: Type /error Inflation. In real rash, is strongly frowned upon to take a bunch of rabies and us starting "shiny" for significant corations. However, for the sake or this lab..... we're going to do it anyway. Now that we've ruled out the three discrete variables, we will simply ignore them. We're going to calculate the correlations between CollegeGPA and all of the other variables-the continuous variables. SPSS INSTRUCTIONS - FINDING CORRELATIONS IN THE DATA: 1. In SPSS, click over to Variable View (tab on bottom left). In the column labelled "Measure, set each variable to the appropriate Measure, like the following MEASURE NON VARIABLE NAME Name Gender Major CollegeGPA High SchoolGPA Hours study Hours work Houts party Hours family Hours media Motivation Noma Scale Scale Scale Scale Scale Scale Scal Scal 2 Go to Analyse > Correlate > Bivariate 3. In the box that pops up. notice that all of your continuous variables all the ones you just chose "Scale for) are listed there in the box on the left. Click on the top vanate CollegeGPA. Now WHILE HOLDING THE SHIFT BUTTON ON YOUR KEYBOARD, click the very bottom vanable, Motivation if you did this correctly then you should see that you have selected All of the variables in the box on the left Now Click the right arrow button to simultaneously move this whole lot of variables over to the box on the 4. The type of correlation we want to calculate is the Pearson Correlation coefficient. Make sure the box for "Pearson is checked. 5: Make sure the box for a ficant correlations checked! This will result in SPSS using sterk Section 2: Pearson Correlation (Ch. 14 - 14 half Your job in this section will be to find the variables that are strongly correlated with College GPA Some of these instructions are long, but it's important that you read them all The data I am giving you come from an imaginary survey of 25 students at this college. The survey contained 11 questions. Each question will become a variable in our data. These 11 variables will be represented as 11 columns, in both Excel and SPSS. Here are the imaginary survey questions--familiarize yourself with these survey questions (and the accompanying variable names) before moving on: SURVEY QUESTION (EXACT WORDING) 1. What is your name? 2. What is your gender? 3. What is your major or intended major in college? 4. What is your current college GPA? S. What was your high school GPA? 6. How many hours per week do you study for classes? 7. How many hours per week do you work at a job or jobs? & How many hours per week do you party? 9. How many hours per week do you do family responsibilities (Childcare, etc. 12 10. How many hours per week do you spend consuming media games TV etc.)? 11. Ona 1 to 10 scale, how motivated are you to get good grades in college? VARIABLE NAME Name Gender Major College GPA HighschoolGPA Hours study Hours work Hours party Hours family Hours_media Motivation SPSS INSTRUCTIONS IMPORTING THE DATA FROM EXCEL TO SPSS 1 Download the Excel file called "SPSS Packet 3 (data)" from Canvas. To do this you will have to open a Chrome browser on the Chaffey computer and login to Canvas. Chaffey.edu. Even if you are already logged into Canvas on your own computer. You do this within the horizon.challey.edu tak in other words on the Chaffey computer 2 Open the file and take a look at it 2 Recall that our survey had n 25 participants. So you should see 25 rows of data. There's aboa first row with the variable names so there are 2 rows total b. Recall that our survey asked 11 questions, and that each question is a separate variable, so you should see 11 columns in the spreadsheet If this all looks good, then save the Excel file to the DESKTOP Click on File > Save As > Desktop After saving it to the desktop, close the Excel 1. Open SPSS Choose "New Dataset" and hit the Enter button on your keyboard 4. In SPSS, o to File > Open Data. Then fotlow the xt few instructions very carefully a. Near the top of the open dialog box, there's a drop-down menu labelled "Look In. In that drop-down menu, choose Desktop b. Near the bottom of the open dialog box, there's a drop down menu labelled "Files of Type. choose "Excelsiswym of this will be SPSS, not in Excel We're going to start looking for significant correlations with College GPA Pearson correlations only work for continuous variables QUESTION & Which three variables in our dataset are discrete, and therefore not appropriate for correlations? Hint: all three discrete variables are also Nominal &ldo Mode us warn ANOVA turis dunerous fe de multiple Hest, also dangerous te de multiple carnations, and for the reason: Type /error Inflation. In real rash, is strongly frowned upon to take a bunch of rabies and us starting "shiny" for significant corations. However, for the sake or this lab..... we're going to do it anyway. Now that we've ruled out the three discrete variables, we will simply ignore them. We're going to calculate the correlations between CollegeGPA and all of the other variables-the continuous variables. SPSS INSTRUCTIONS - FINDING CORRELATIONS IN THE DATA: 1. In SPSS, click over to Variable View (tab on bottom left). In the column labelled "Measure, set each variable to the appropriate Measure, like the following MEASURE NON VARIABLE NAME Name Gender Major CollegeGPA High SchoolGPA Hours study Hours work Houts party Hours family Hours media Motivation Noma Scale Scale Scale Scale Scale Scale Scal Scal 2 Go to Analyse > Correlate > Bivariate 3. In the box that pops up. notice that all of your continuous variables all the ones you just chose "Scale for) are listed there in the box on the left. Click on the top vanate CollegeGPA. Now WHILE HOLDING THE SHIFT BUTTON ON YOUR KEYBOARD, click the very bottom vanable, Motivation if you did this correctly then you should see that you have selected All of the variables in the box on the left Now Click the right arrow button to simultaneously move this whole lot of variables over to the box on the 4. The type of correlation we want to calculate is the Pearson Correlation coefficient. Make sure the box for "Pearson is checked. 5: Make sure the box for a ficant correlations checked! This will result in SPSS using sterk