

Question: Man 4720: BSG Final Report and Presentation Instructions Due: at the end of module 7 (end of week 14) At the conclusion of the 8
Man 4720: BSG Final Report and Presentation Instructions Due: at the end of module 7 (end of week 14) At the conclusion of the 8 simulation decision rounds, each simulation team will be required to submit a company presentation (Power Point). Slide 7: A slide describing your companys finance strategy (as concerns dividends, use of debt versus equity, stock issues/repurchases, actions to achieve/maintain a strong credit rating, etc.) You should clearly describe your companys dividend policy during the period you have managed the company. Here, you should also set forth what sort of dividend increases, if any; you would likely consider paying out in the next two upcoming years (given the EPS targets you have established).
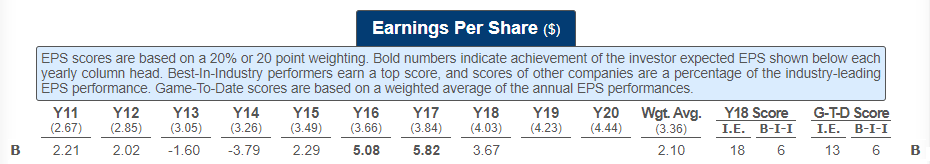
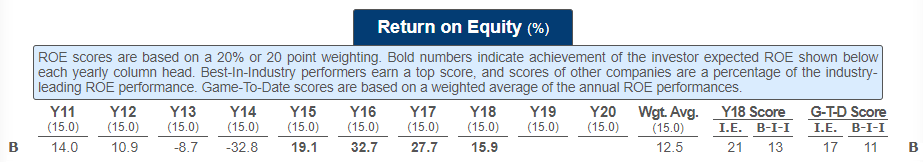
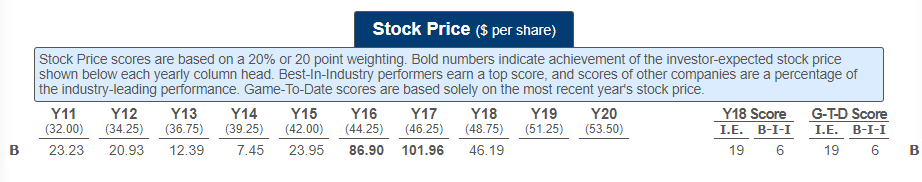
( Earnings Per Share (S) EPS scores are based on a 20% or 20 point weighting Bold numbers indicate achievement of the investor expected EPS shown below each yearly column head. Best-In-Industry performers earn a top score, and scores of other companies are a percentage of the industry-leading EPS performance. Game-To-Date scores are based on a weighted average of the annual EPS performances Y11 Y12 Y13 Y14 Y15 Y16 Y17 Y18 Y19 Y20 Wgt Avg. Y18 Score G-T-D Score (2.67) (2.85) (3.05) 3.26) 3.49) (3.66) 3.84) 4.03) 4.23) 4.44) (3.36) I.E. B-I-I IE. B-I-I B 2.21 2.02 1.60 3.79 2.29 5.08 5.82 3.67 2.10 8 63 Return on Equity (%) ROE scores are based on a 20% or 20 point weighting Bold numbers indicate achievement of the investor expected ROE shown below each yearly column head. Best-In-Industry performers earn a top score, and scores of other companies are a percentage of the industry leading ROE performance. Game-To-Date scores are based on a weighted average of the annual ROE performances Y11 Y12 Y13 Y14 Y15Y16 Y17 Y18 Y19 Y20 Wgt Avg. Y18 Score GTD Score 15.0) 15.0) 15.0) 5.0 15.0 15.0 1.0 150 50 5.0 5. E B-I-I IE. B-I- B 14.0 0.98.7 328 9. 32.727.715.9 12.5 21 13 Stock Price ($ per share) Stock Price scores are based on a 20% or 20 point weighting. Bold numbers indicate achievement of the investor-expected stock price shown below each yearly column head. Best-In-Industry performers earn a top score, and scores of other companies are a percentage of the industry-leading performance. Game-To-Date scores are based solely on the most recent s stock price. Y11 Y12 Y13 Y14 Y15 Y16 Y17 Y18 Y19 Y20 (32.00) (34.25) (36.75) (39.25) (42.00) (44.25) (46.25) (48.75) (51.25) (53.50) Y18 Score G-T-D Score 19 6 19 6B 23.23 20.93 12.39 7.45 23.95 86.90 101.96 46.19 ( Earnings Per Share (S) EPS scores are based on a 20% or 20 point weighting Bold numbers indicate achievement of the investor expected EPS shown below each yearly column head. Best-In-Industry performers earn a top score, and scores of other companies are a percentage of the industry-leading EPS performance. Game-To-Date scores are based on a weighted average of the annual EPS performances Y11 Y12 Y13 Y14 Y15 Y16 Y17 Y18 Y19 Y20 Wgt Avg. Y18 Score G-T-D Score (2.67) (2.85) (3.05) 3.26) 3.49) (3.66) 3.84) 4.03) 4.23) 4.44) (3.36) I.E. B-I-I IE. B-I-I B 2.21 2.02 1.60 3.79 2.29 5.08 5.82 3.67 2.10 8 63 Return on Equity (%) ROE scores are based on a 20% or 20 point weighting Bold numbers indicate achievement of the investor expected ROE shown below each yearly column head. Best-In-Industry performers earn a top score, and scores of other companies are a percentage of the industry leading ROE performance. Game-To-Date scores are based on a weighted average of the annual ROE performances Y11 Y12 Y13 Y14 Y15Y16 Y17 Y18 Y19 Y20 Wgt Avg. Y18 Score GTD Score 15.0) 15.0) 15.0) 5.0 15.0 15.0 1.0 150 50 5.0 5. E B-I-I IE. B-I- B 14.0 0.98.7 328 9. 32.727.715.9 12.5 21 13 Stock Price ($ per share) Stock Price scores are based on a 20% or 20 point weighting. Bold numbers indicate achievement of the investor-expected stock price shown below each yearly column head. Best-In-Industry performers earn a top score, and scores of other companies are a percentage of the industry-leading performance. Game-To-Date scores are based solely on the most recent s stock price. Y11 Y12 Y13 Y14 Y15 Y16 Y17 Y18 Y19 Y20 (32.00) (34.25) (36.75) (39.25) (42.00) (44.25) (46.25) (48.75) (51.25) (53.50) Y18 Score G-T-D Score 19 6 19 6B 23.23 20.93 12.39 7.45 23.95 86.90 101.96 46.19
Step by Step Solution
There are 3 Steps involved in it

Get step-by-step solutions from verified subject matter experts