

Question: manager wishes to build a Sample Range Chart for a process. The sample size is Je, the mean of sample means is 16.01, and the
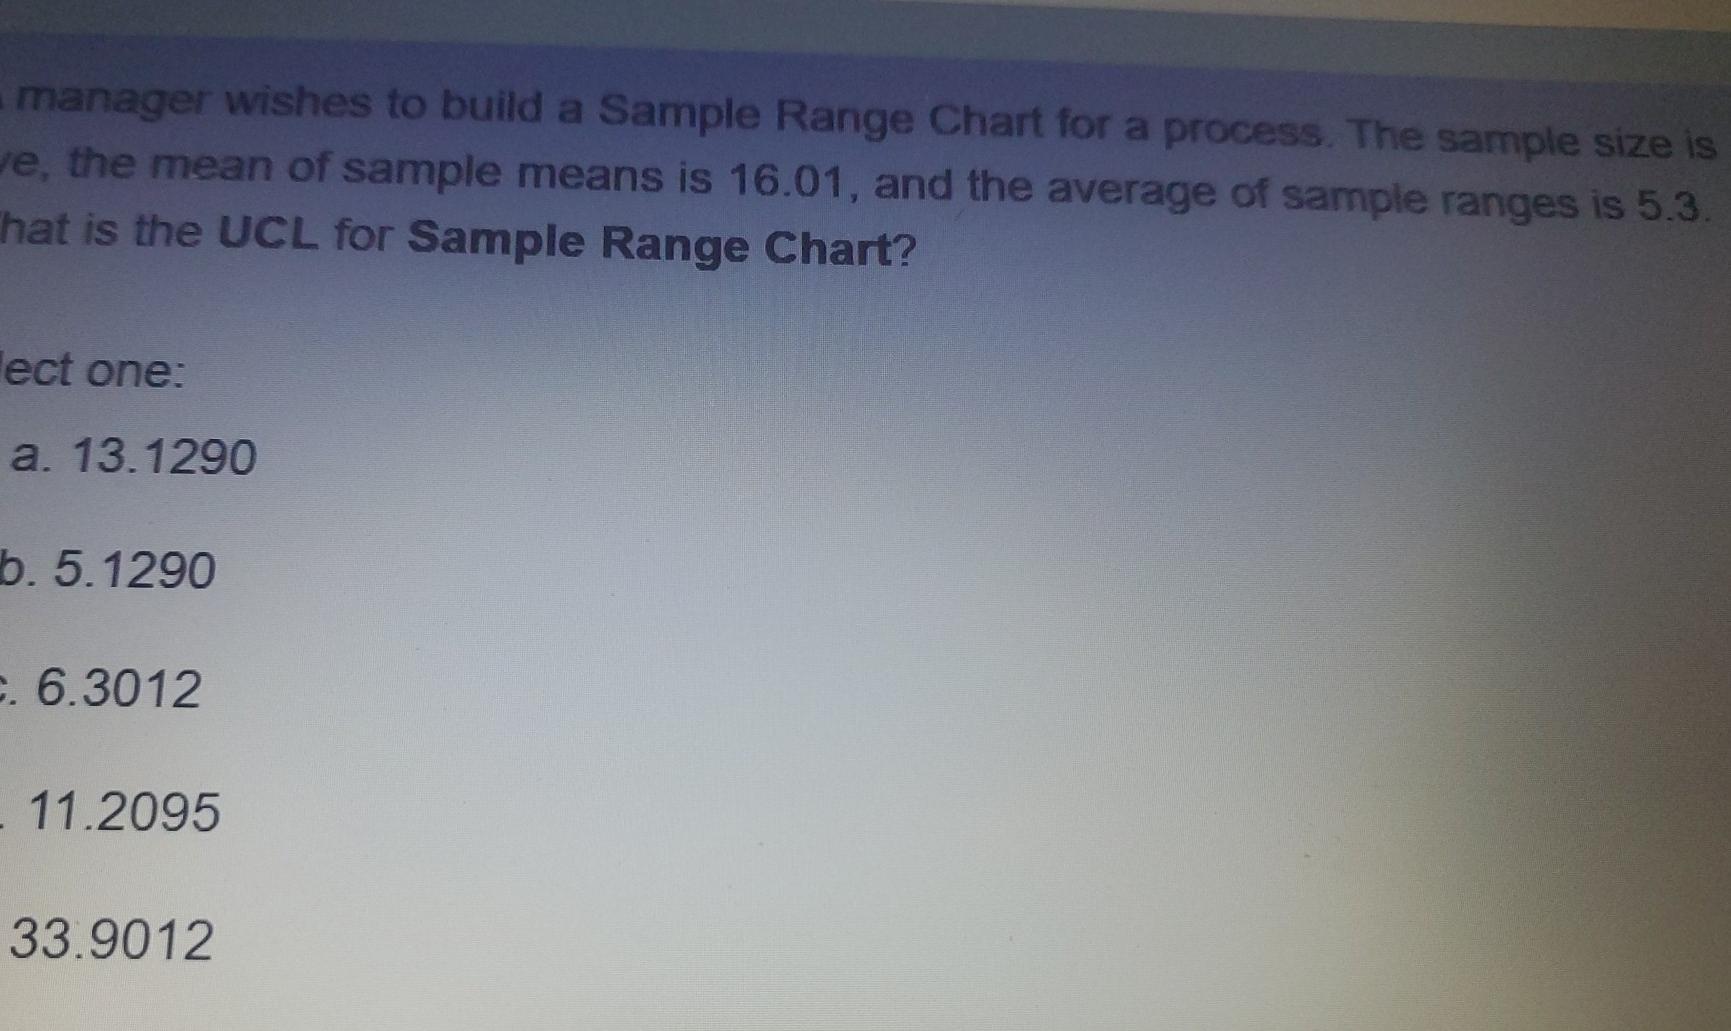
manager wishes to build a Sample Range Chart for a process. The sample size is Je, the mean of sample means is 16.01, and the average of sample ranges is 5.3. That is the UCL for Sample Range Chart? lect one: a. 13.1290 b. 5.1290 2.6.3012 11.2095 33.9012
Step by Step Solution
There are 3 Steps involved in it
1 Expert Approved Answer
Step: 1 Unlock

Question Has Been Solved by an Expert!
Get step-by-step solutions from verified subject matter experts
Step: 2 Unlock
Step: 3 Unlock