

Question: A manager wishes to build a 3 - sigma range chart for a process. The sample size is 7 , the mean of sample means
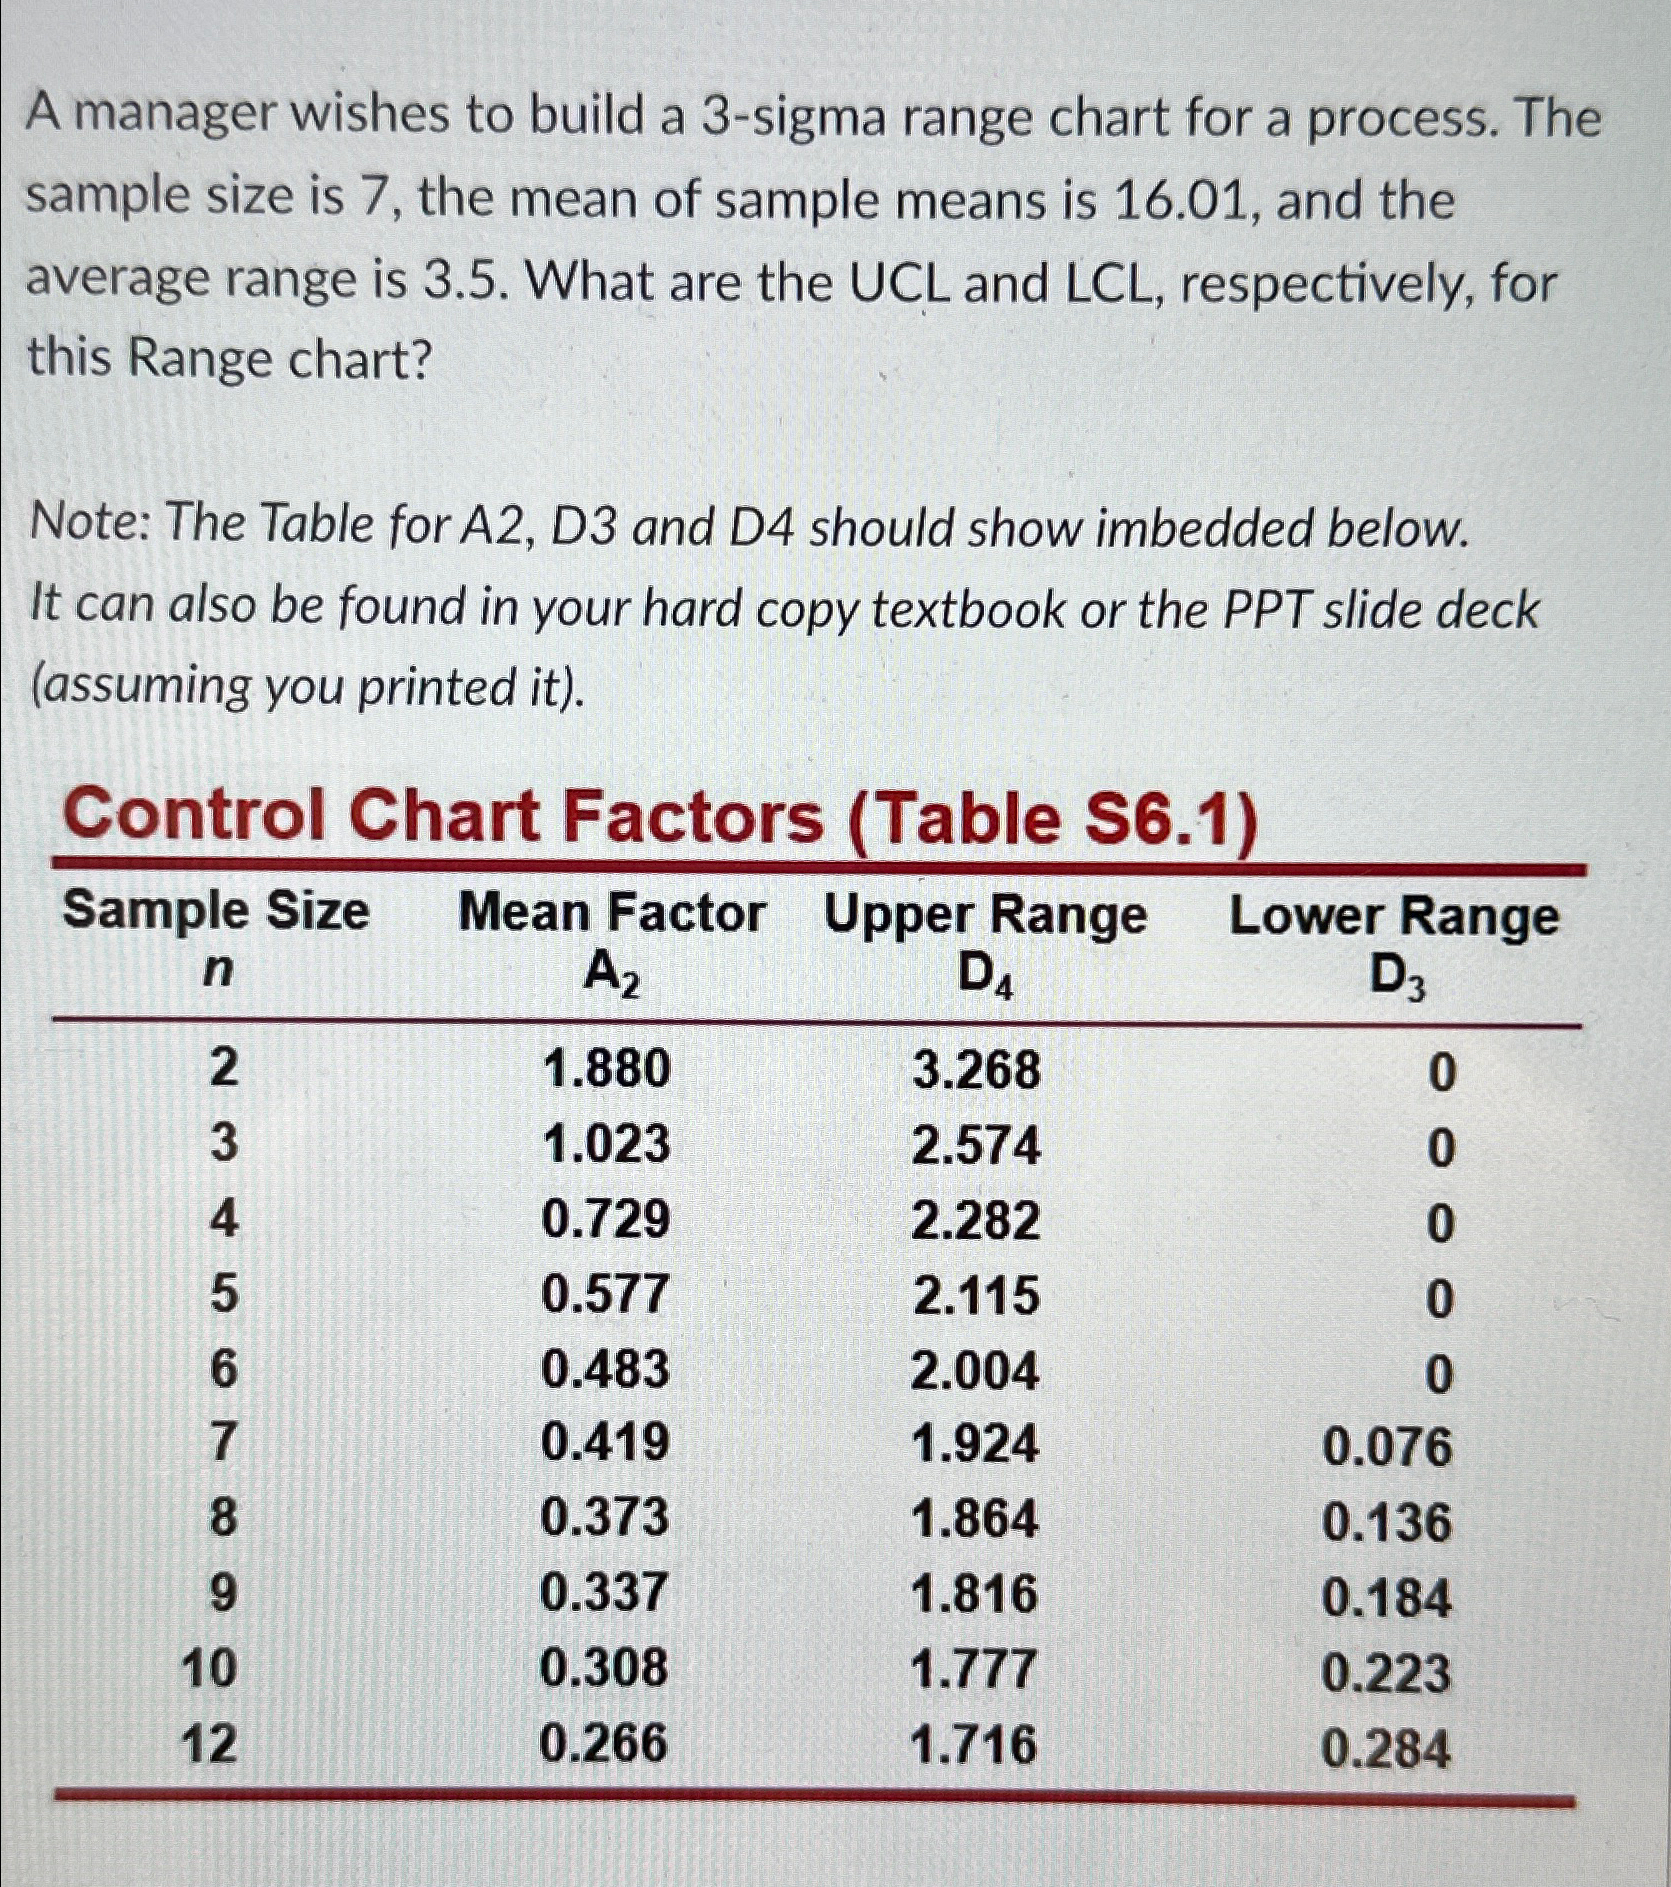
A manager wishes to build a sigma range chart for a process. The sample size is the mean of sample means is and the average range is What are the UCL and respectively, for this Range chart?
Note: The Table for A D and D should show imbedded below. It can also be found in your hard copy textbook or the PPT slide deck assuming you printed it
Control Chart Factors Table S
tabletableSample Size
Step by Step Solution
There are 3 Steps involved in it
1 Expert Approved Answer
Step: 1 Unlock

Question Has Been Solved by an Expert!
Get step-by-step solutions from verified subject matter experts
Step: 2 Unlock
Step: 3 Unlock