

Question: Manhattan plots in GWAS studies ( such as that shown below ) often show a series of SNPs in close physical proximity in the genome
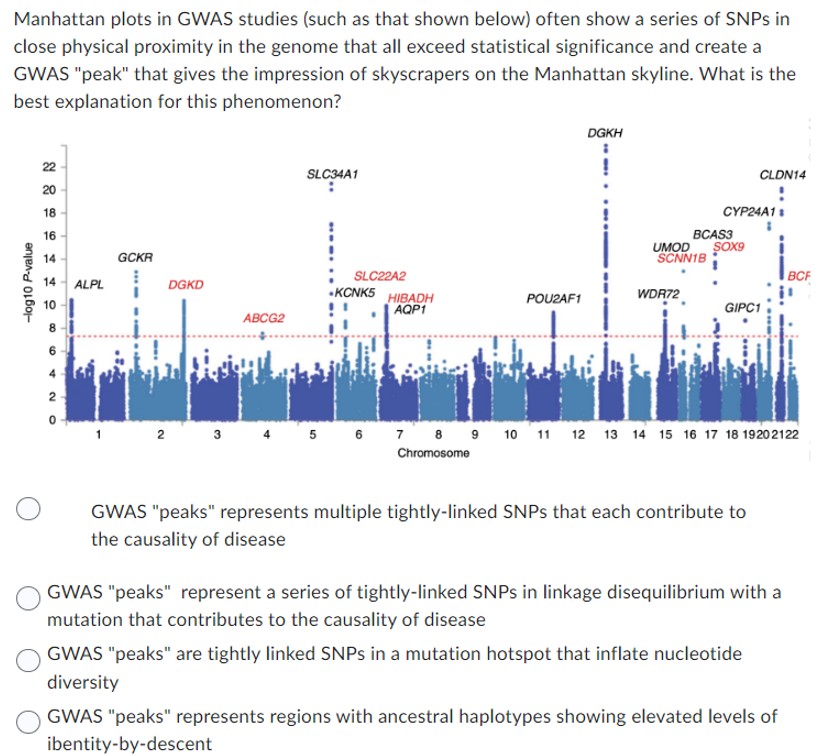
Manhattan plots in GWAS studies such as that shown below often show a series of SNPs in
close physical proximity in the genome that all exceed statistical significance and create a
GWAS "peak" that gives the impression of skyscrapers on the Manhattan skyline. What is the
best explanation for this phenomenon?
GWAS "peaks" represents multiple tightlylinked SNPs that each contribute to
the causality of disease
GWAS "peaks" represent a series of tightlylinked SNPs in linkage disequilibrium with a
mutation that contributes to the causality of disease
GWAS "peaks" are tightly linked SNPs in a mutation hotspot that inflate nucleotide
diversity
GWAS "peaks" represents regions with ancestral haplotypes showing elevated levels of
ibentitybydescent
Step by Step Solution
There are 3 Steps involved in it
1 Expert Approved Answer
Step: 1 Unlock

Question Has Been Solved by an Expert!
Get step-by-step solutions from verified subject matter experts
Step: 2 Unlock
Step: 3 Unlock