

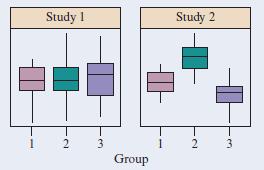
Question: 14.6 ANOVA and box plots For two studies, each comparing three groups, the box plots below show results. (Each box plot is based on a
14.6 ANOVA and box plots For two studies, each comparing three groups, the box plots below show results. (Each box plot is based on a random sample of size 40.)
a. Judging from the box plots, which study will more likely lead to a rejection of the ANOVA null hypothesis of equal population means? Explain.
b. Which study will have the large value for the F test statistic? Why?
c. The P-value for the ANOVA F test for the second study equals 0.001. Does this necessarily imply that all three population means are different from each other?
1 2 3 Study 1 Study 2 Group N. 2 3
Step by Step Solution
There are 3 Steps involved in it
1 Expert Approved Answer
Step: 1 Unlock

Question Has Been Solved by an Expert!
Get step-by-step solutions from verified subject matter experts
Step: 2 Unlock
Step: 3 Unlock