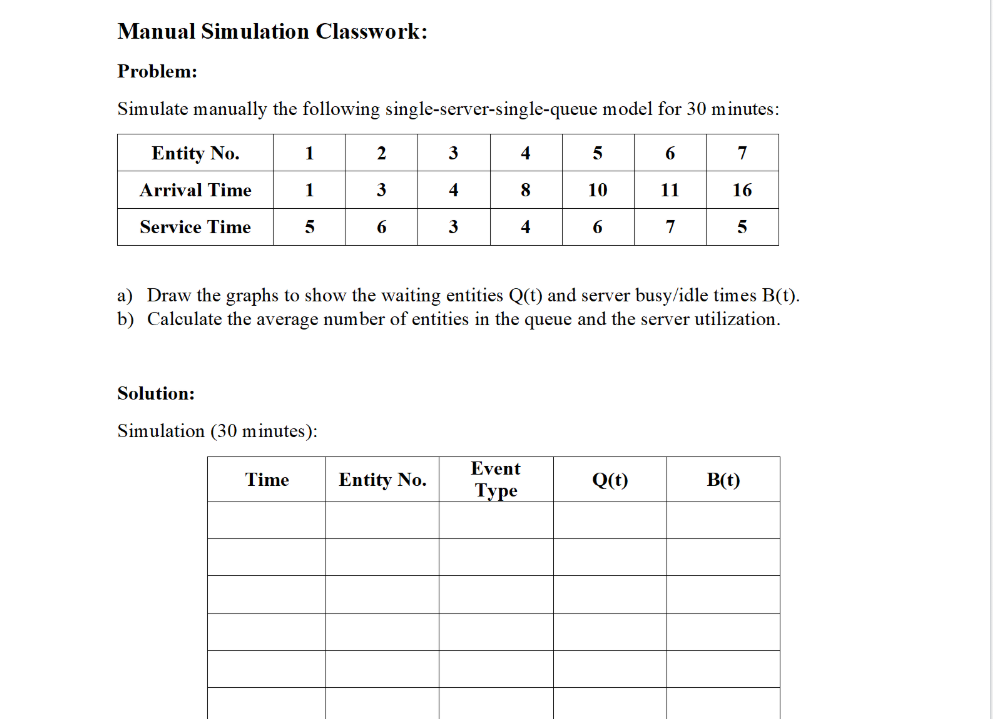
Question: Manual Simulation Classwork: Problem: Simulate manually the following single-server-single-queue model for 30 minutes: Entity No. 1 2 3 4 5 6 7 Arrival Time 1

Manual Simulation Classwork: Problem: Simulate

Manual Simulation Classwork: Problem: Simulate manually the following single-server-single-queue model for 30 minutes: Entity No. 1 2 3 4 5 6 7 Arrival Time 1 3 4 8 10 11 16 Service Time 5 6 3 4 6 7 5 a) Draw the graphs to show the waiting entities Q(t) and server busy/idle times B(t). b) Calculate the average number of entities in the queue and the server utilization. Solution: Simulation (30 minutes): Time Entity No. Event Type Q(t) B(t) Manual Simulation Classwork: Problem: Simulate manually the following single-server-single-queue model for 30 minutes: Entity No. 1 2 3 4 5 6 7 Arrival Time 1 3 4 8 10 11 16 Service Time 5 6 3 4 6 7 5 a) Draw the graphs to show the waiting entities Q(t) and server busy/idle times B(t). b) Calculate the average number of entities in the queue and the server utilization. Solution: Simulation (30 minutes): Time Entity No. Event Type Q(t) B(t)

Step by Step Solution

There are 3 Steps involved in it

1 Expert Approved Answer
Step: 1 Unlock blur-text-image
Question Has Been Solved by an Expert!

Get step-by-step solutions from verified subject matter experts

Step: 2 Unlock
Step: 3 Unlock

Students Have Also Explored These Related General Management Questions!