

Question: Many college students are working full-time or part-time and trying to balance work, school, and life. When enrolling, students completed a questionnaire where one
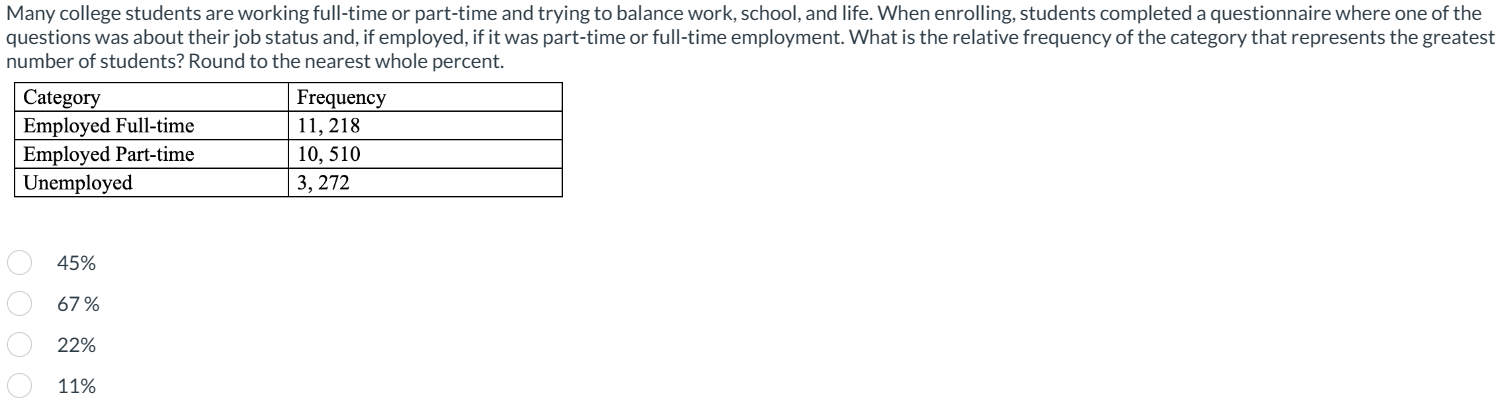
Many college students are working full-time or part-time and trying to balance work, school, and life. When enrolling, students completed a questionnaire where one of the questions was about their job status and, if employed, if it was part-time or full-time employment. What is the relative frequency of the category that represents the greatest number of students? Round to the nearest whole percent. Category Employed Full-time Employed Part-time Unemployed Frequency 11,218 10, 510 3,272 45% 67% 22% 11%
Step by Step Solution
There are 3 Steps involved in it
1 Expert Approved Answer
Step: 1 Unlock

Question Has Been Solved by an Expert!
Get step-by-step solutions from verified subject matter experts
Step: 2 Unlock
Step: 3 Unlock