

Question: MAP4C(Grade12:Math) UNIT 4 DATA MANAGEMENT 1. For each question below (graph, description, situation), match it to one of the r-values listed below (an r-value can
MAP4C(Grade12:Math) UNIT 4 DATA MANAGEMENT
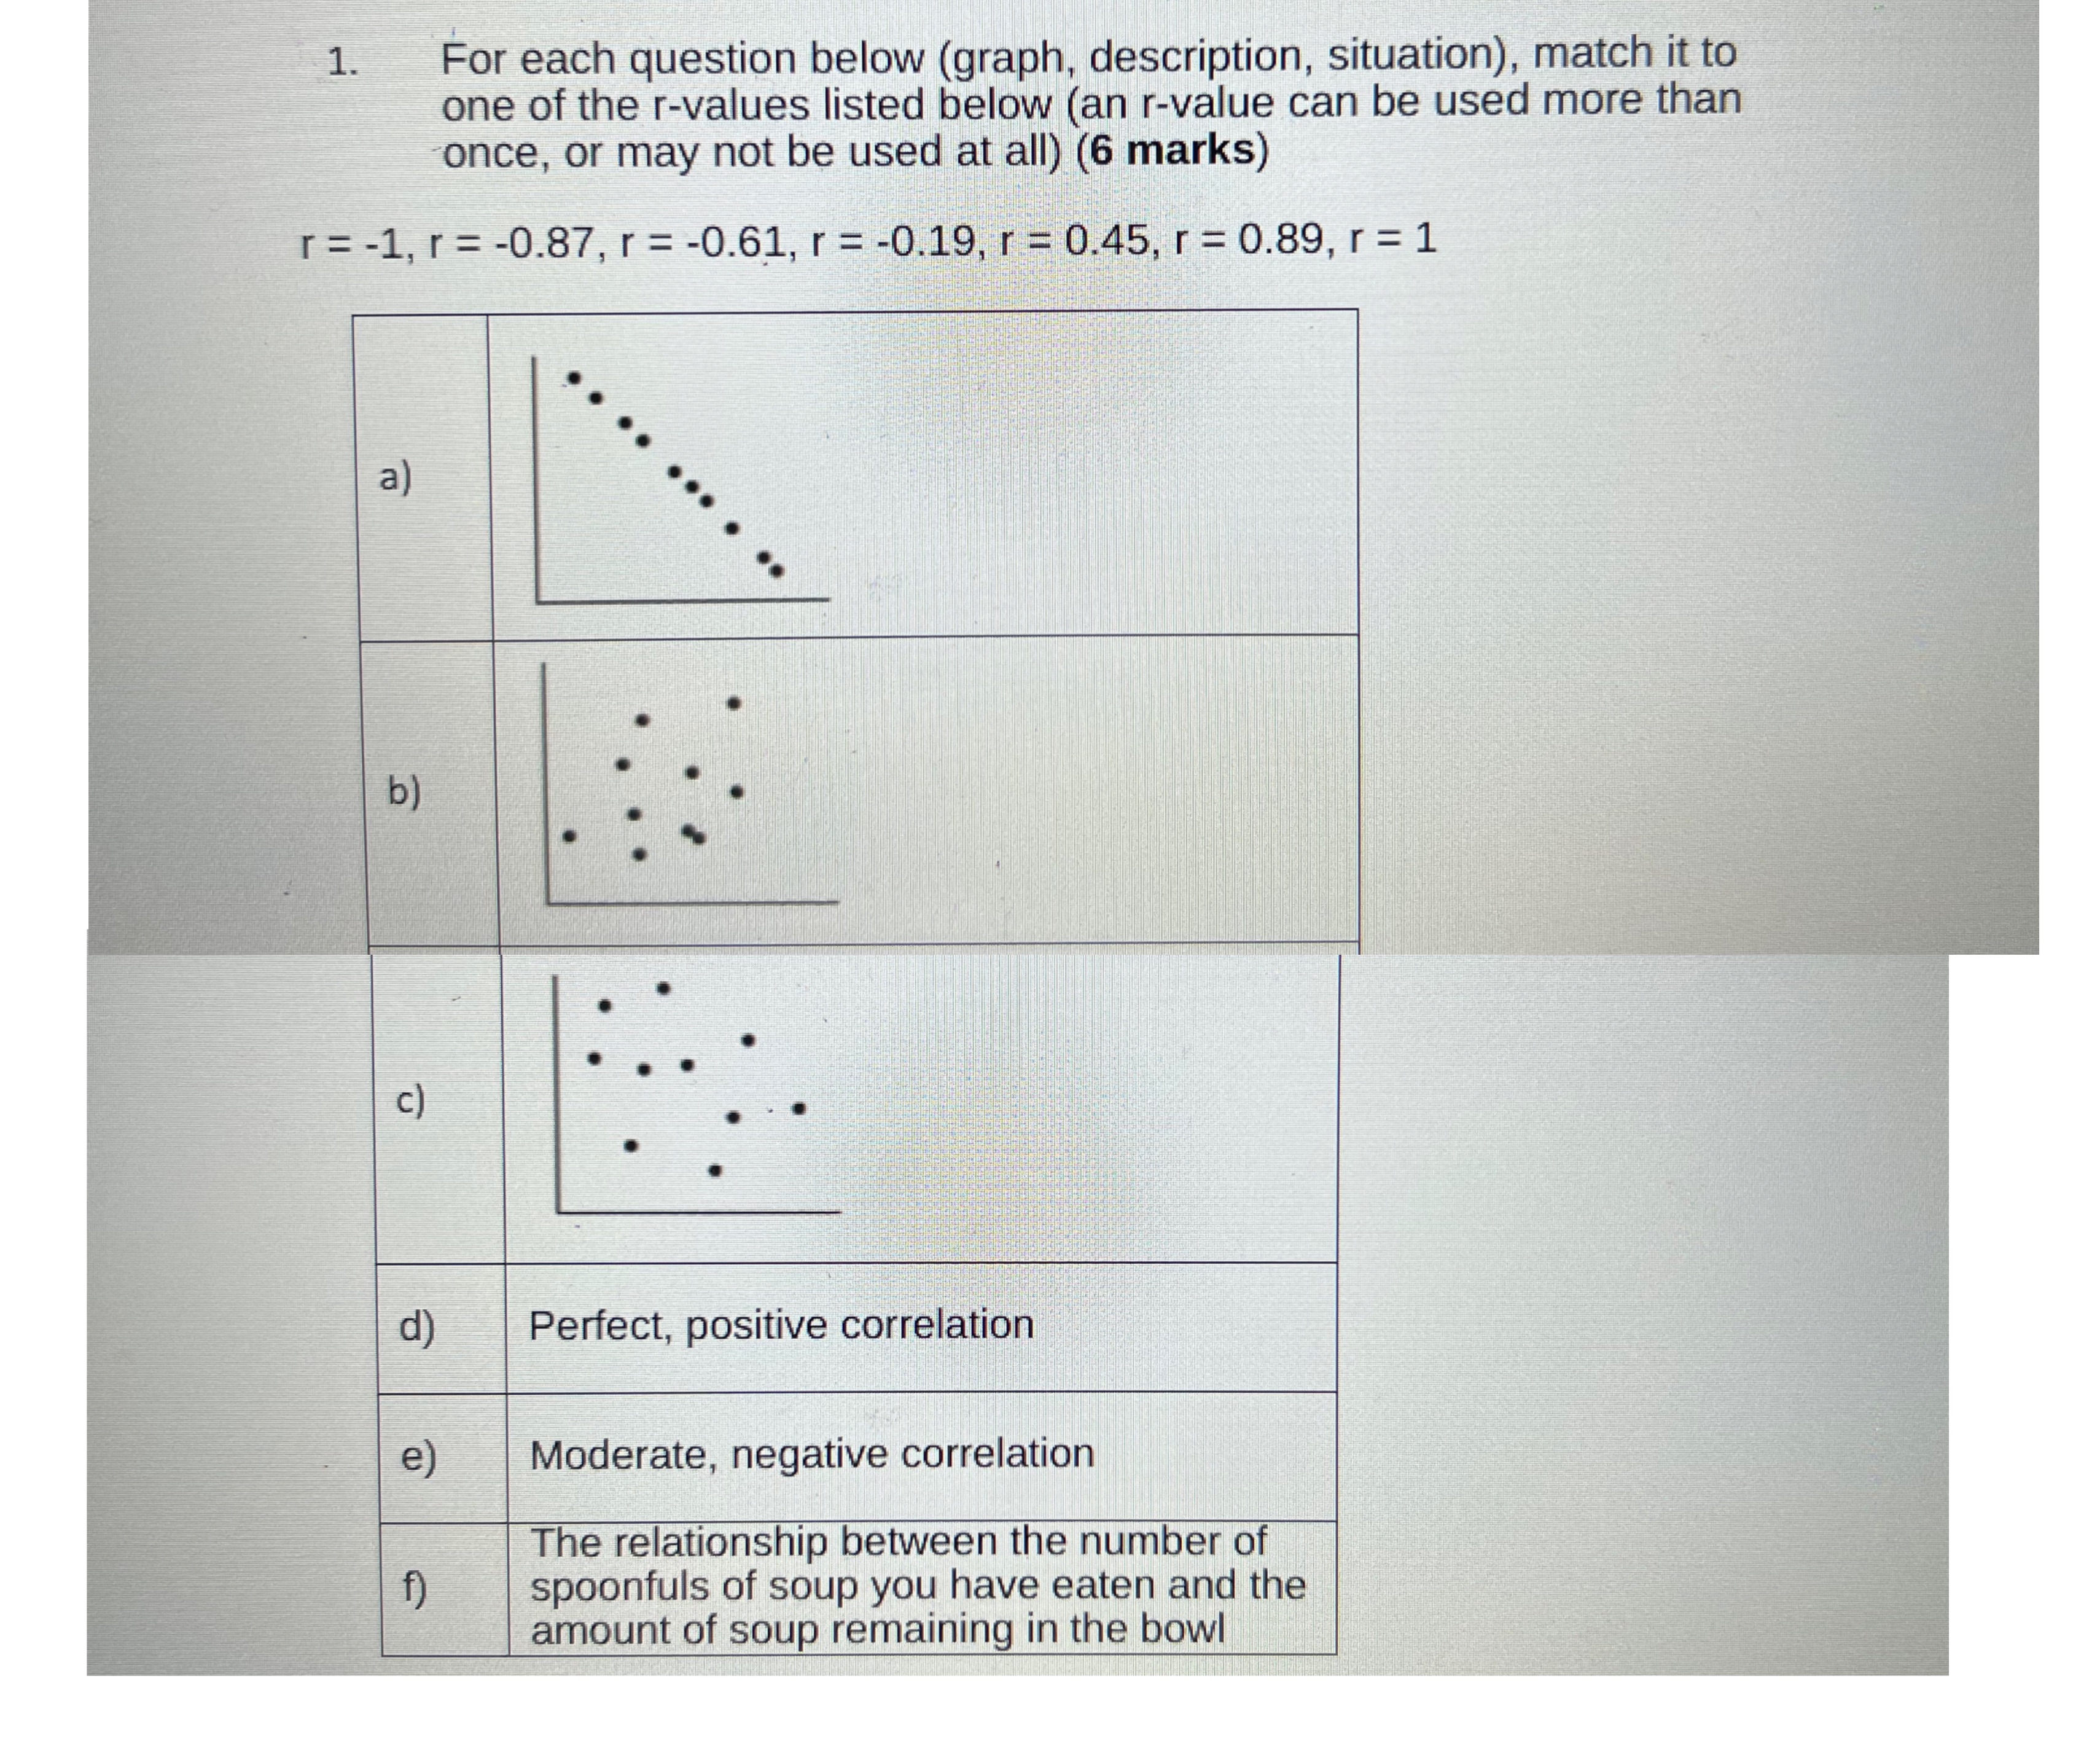
1. For each question below (graph, description, situation), match it to one of the r-values listed below (an r-value can be used more than once, or may not be used at all) (6 marks) r = -1, r = -0.87, r = -0.61, r = -0.19, r = 0.45, r = 0.89, r = 1 a) b ) c) d) Perfect, positive correlation e) Moderate, negative correlation The relationship between the number of f) spoonfuls of soup you have eaten and the amount of soup remaining in the bowl
Step by Step Solution
There are 3 Steps involved in it
1 Expert Approved Answer
Step: 1 Unlock

Question Has Been Solved by an Expert!
Get step-by-step solutions from verified subject matter experts
Step: 2 Unlock
Step: 3 Unlock