

Question: MAP4C(Grade12:Math) UNIT 4 DATA MANAGEMENTI got an answer from other source but still need questions C&D. Thanks :) (4 marks) 4. a) Create a scatter
MAP4C(Grade12:Math) UNIT 4 DATA MANAGEMENTI got an answer from other source but still need questions C&D. Thanks :)
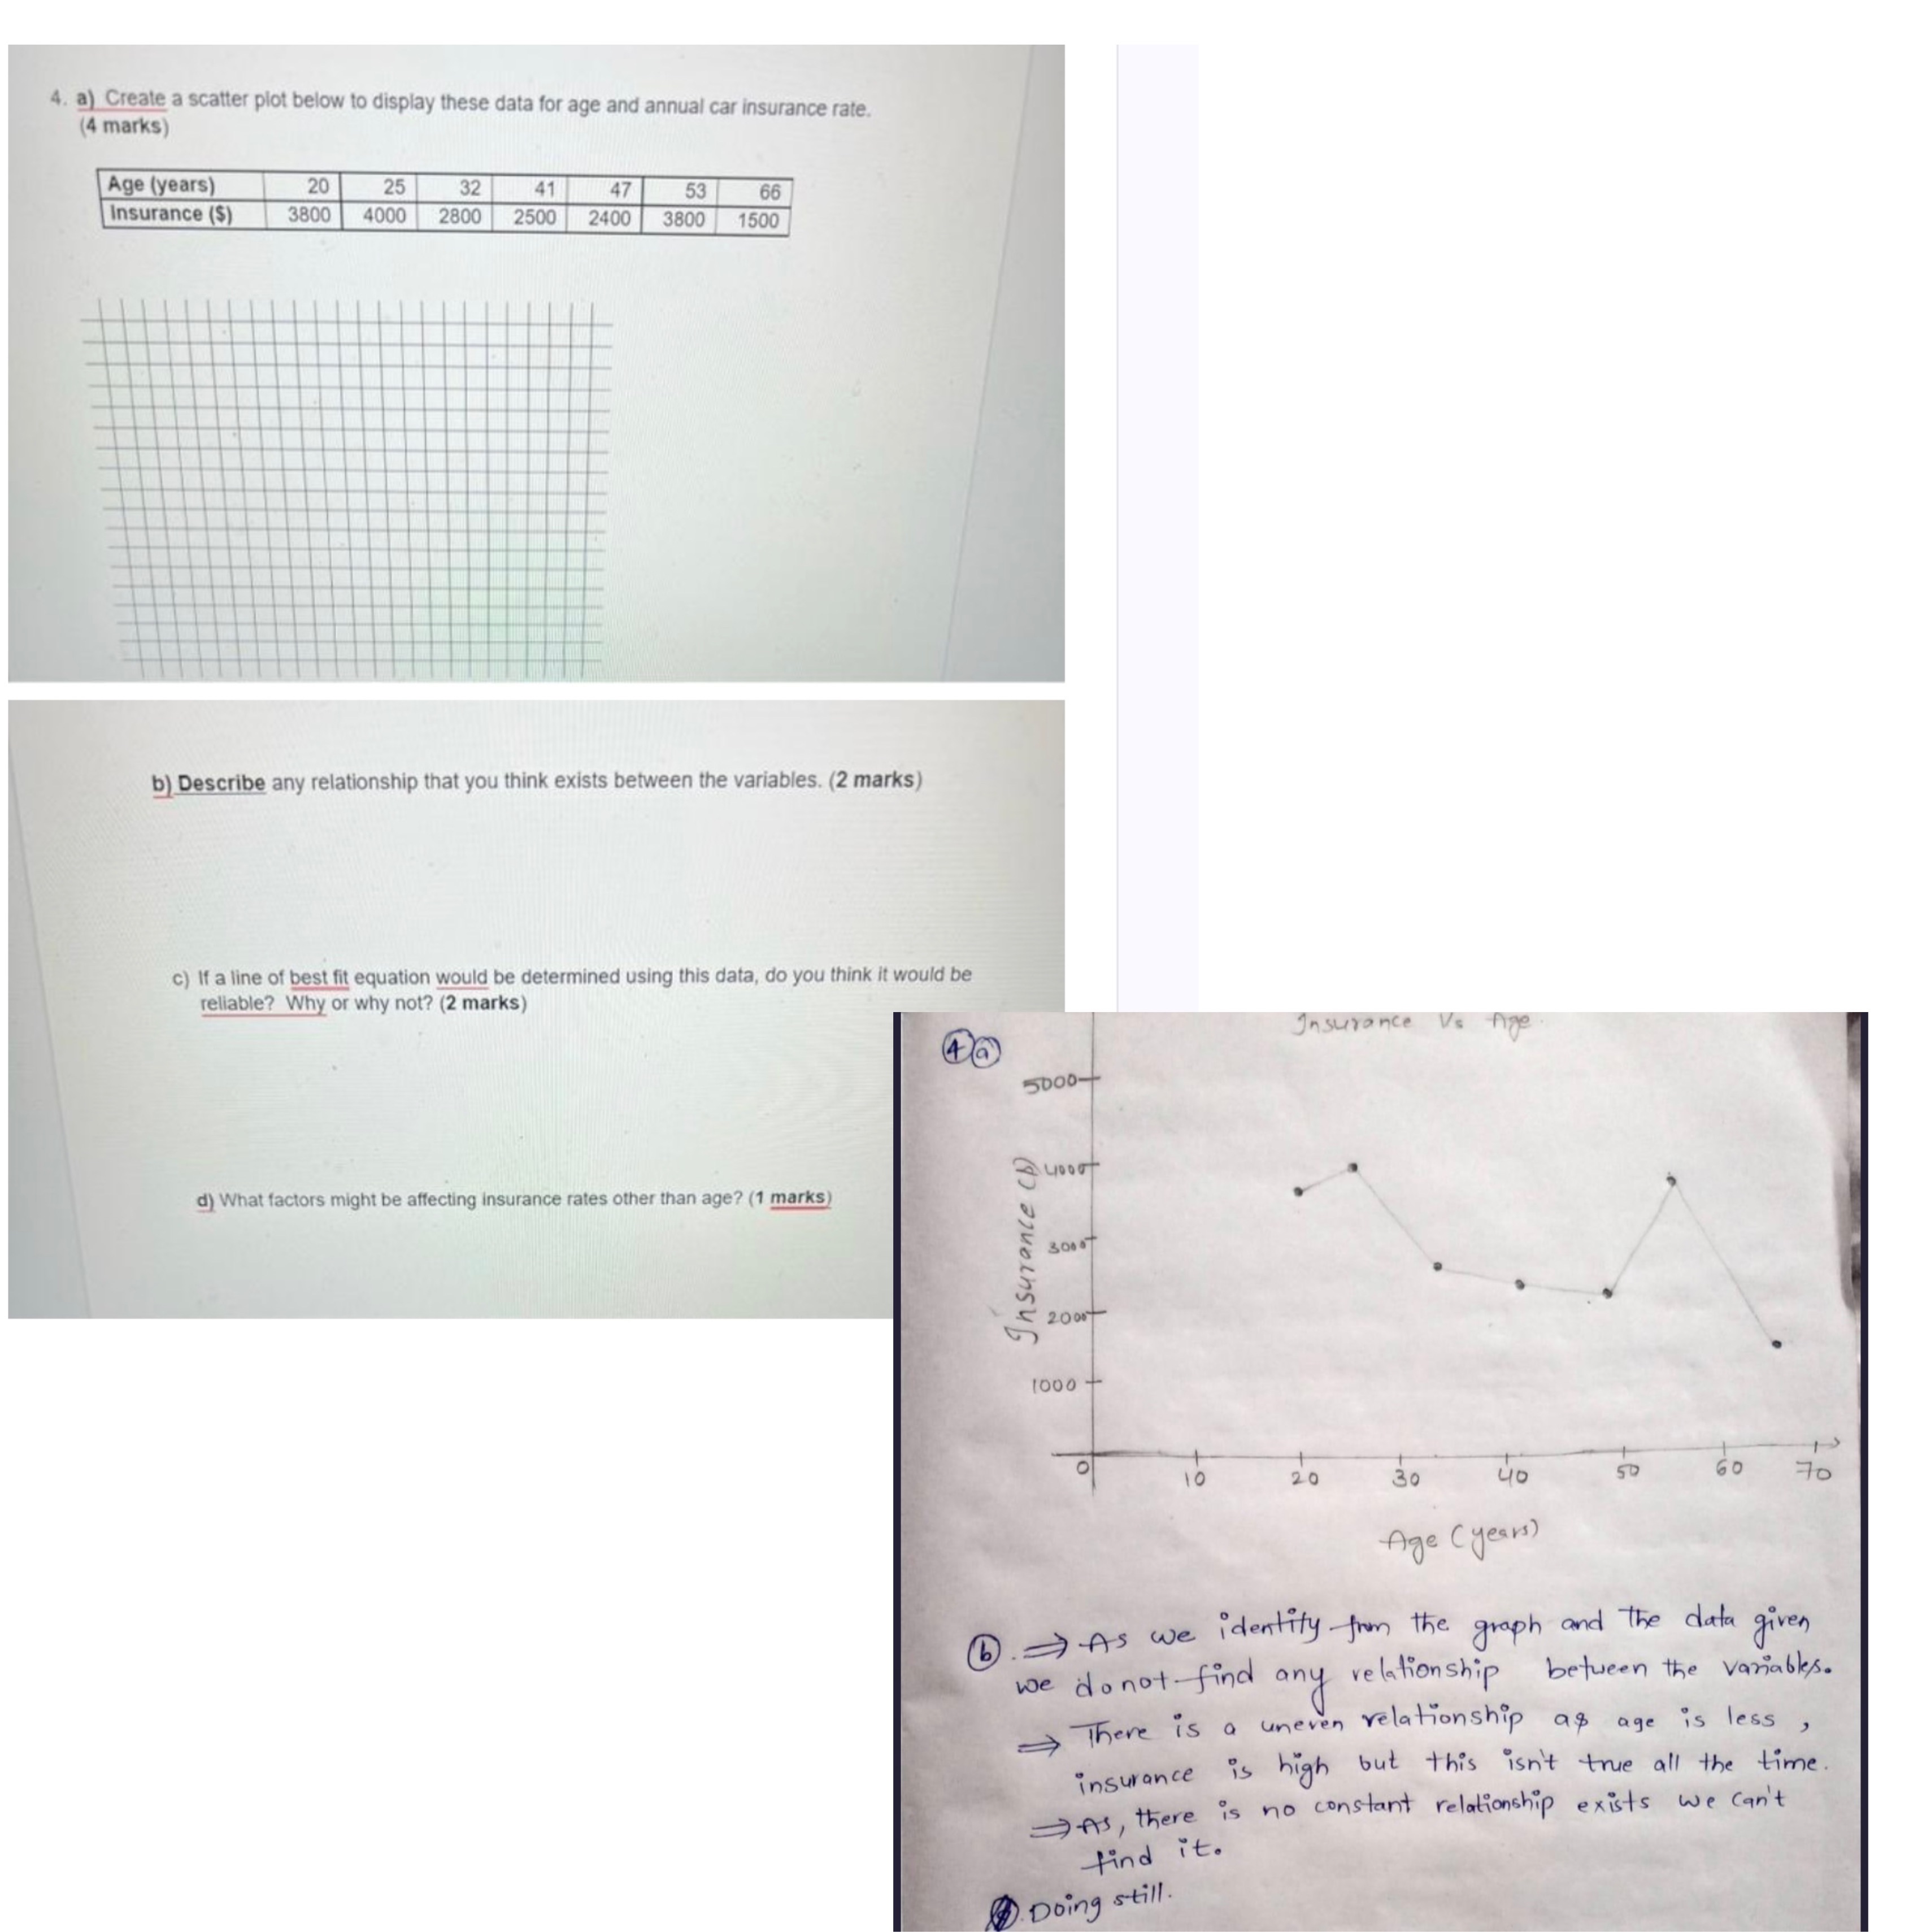
(4 marks) 4. a) Create a scatter plot below to display these data for age and annual car insurance rate Age (years) 20 25 32 Insurance ($) 41 47 53 3800 4000 2800 2500 2400 3800 1500 66 b) Describe any relationship that you think exists between the variables. (2 marks) c) If a line of best fit equation would be determined using this data, do you think it would be reliable? Why or why not? (2 marks) 4 0) Insurance Vs tige 5000- d) What factors might be affecting ins s other than age? (1 marks) 30007 Ins - 20007 1000 + of 10 20 30 40 50 60 70 Age ( years ) (. As we identity from the graph and the data given we do not find any relationship between the variables. There is a uneven relationship as age is less, insurance is high but this isn't true all the time -As , there is no constant relationship exists we can't find it . " Doing still
Step by Step Solution
There are 3 Steps involved in it

Get step-by-step solutions from verified subject matter experts