

Question: MAP4C(Grade12:Math) UNIT 4 DATA MANAGEMENT. Thanks. Make at least one or two question wrong so it's not noticeable I got it from a source online.
MAP4C(Grade12:Math) UNIT 4 DATA MANAGEMENT. Thanks. Make at least one or two question wrong so it's not noticeable I got it from a source online. Thank you.
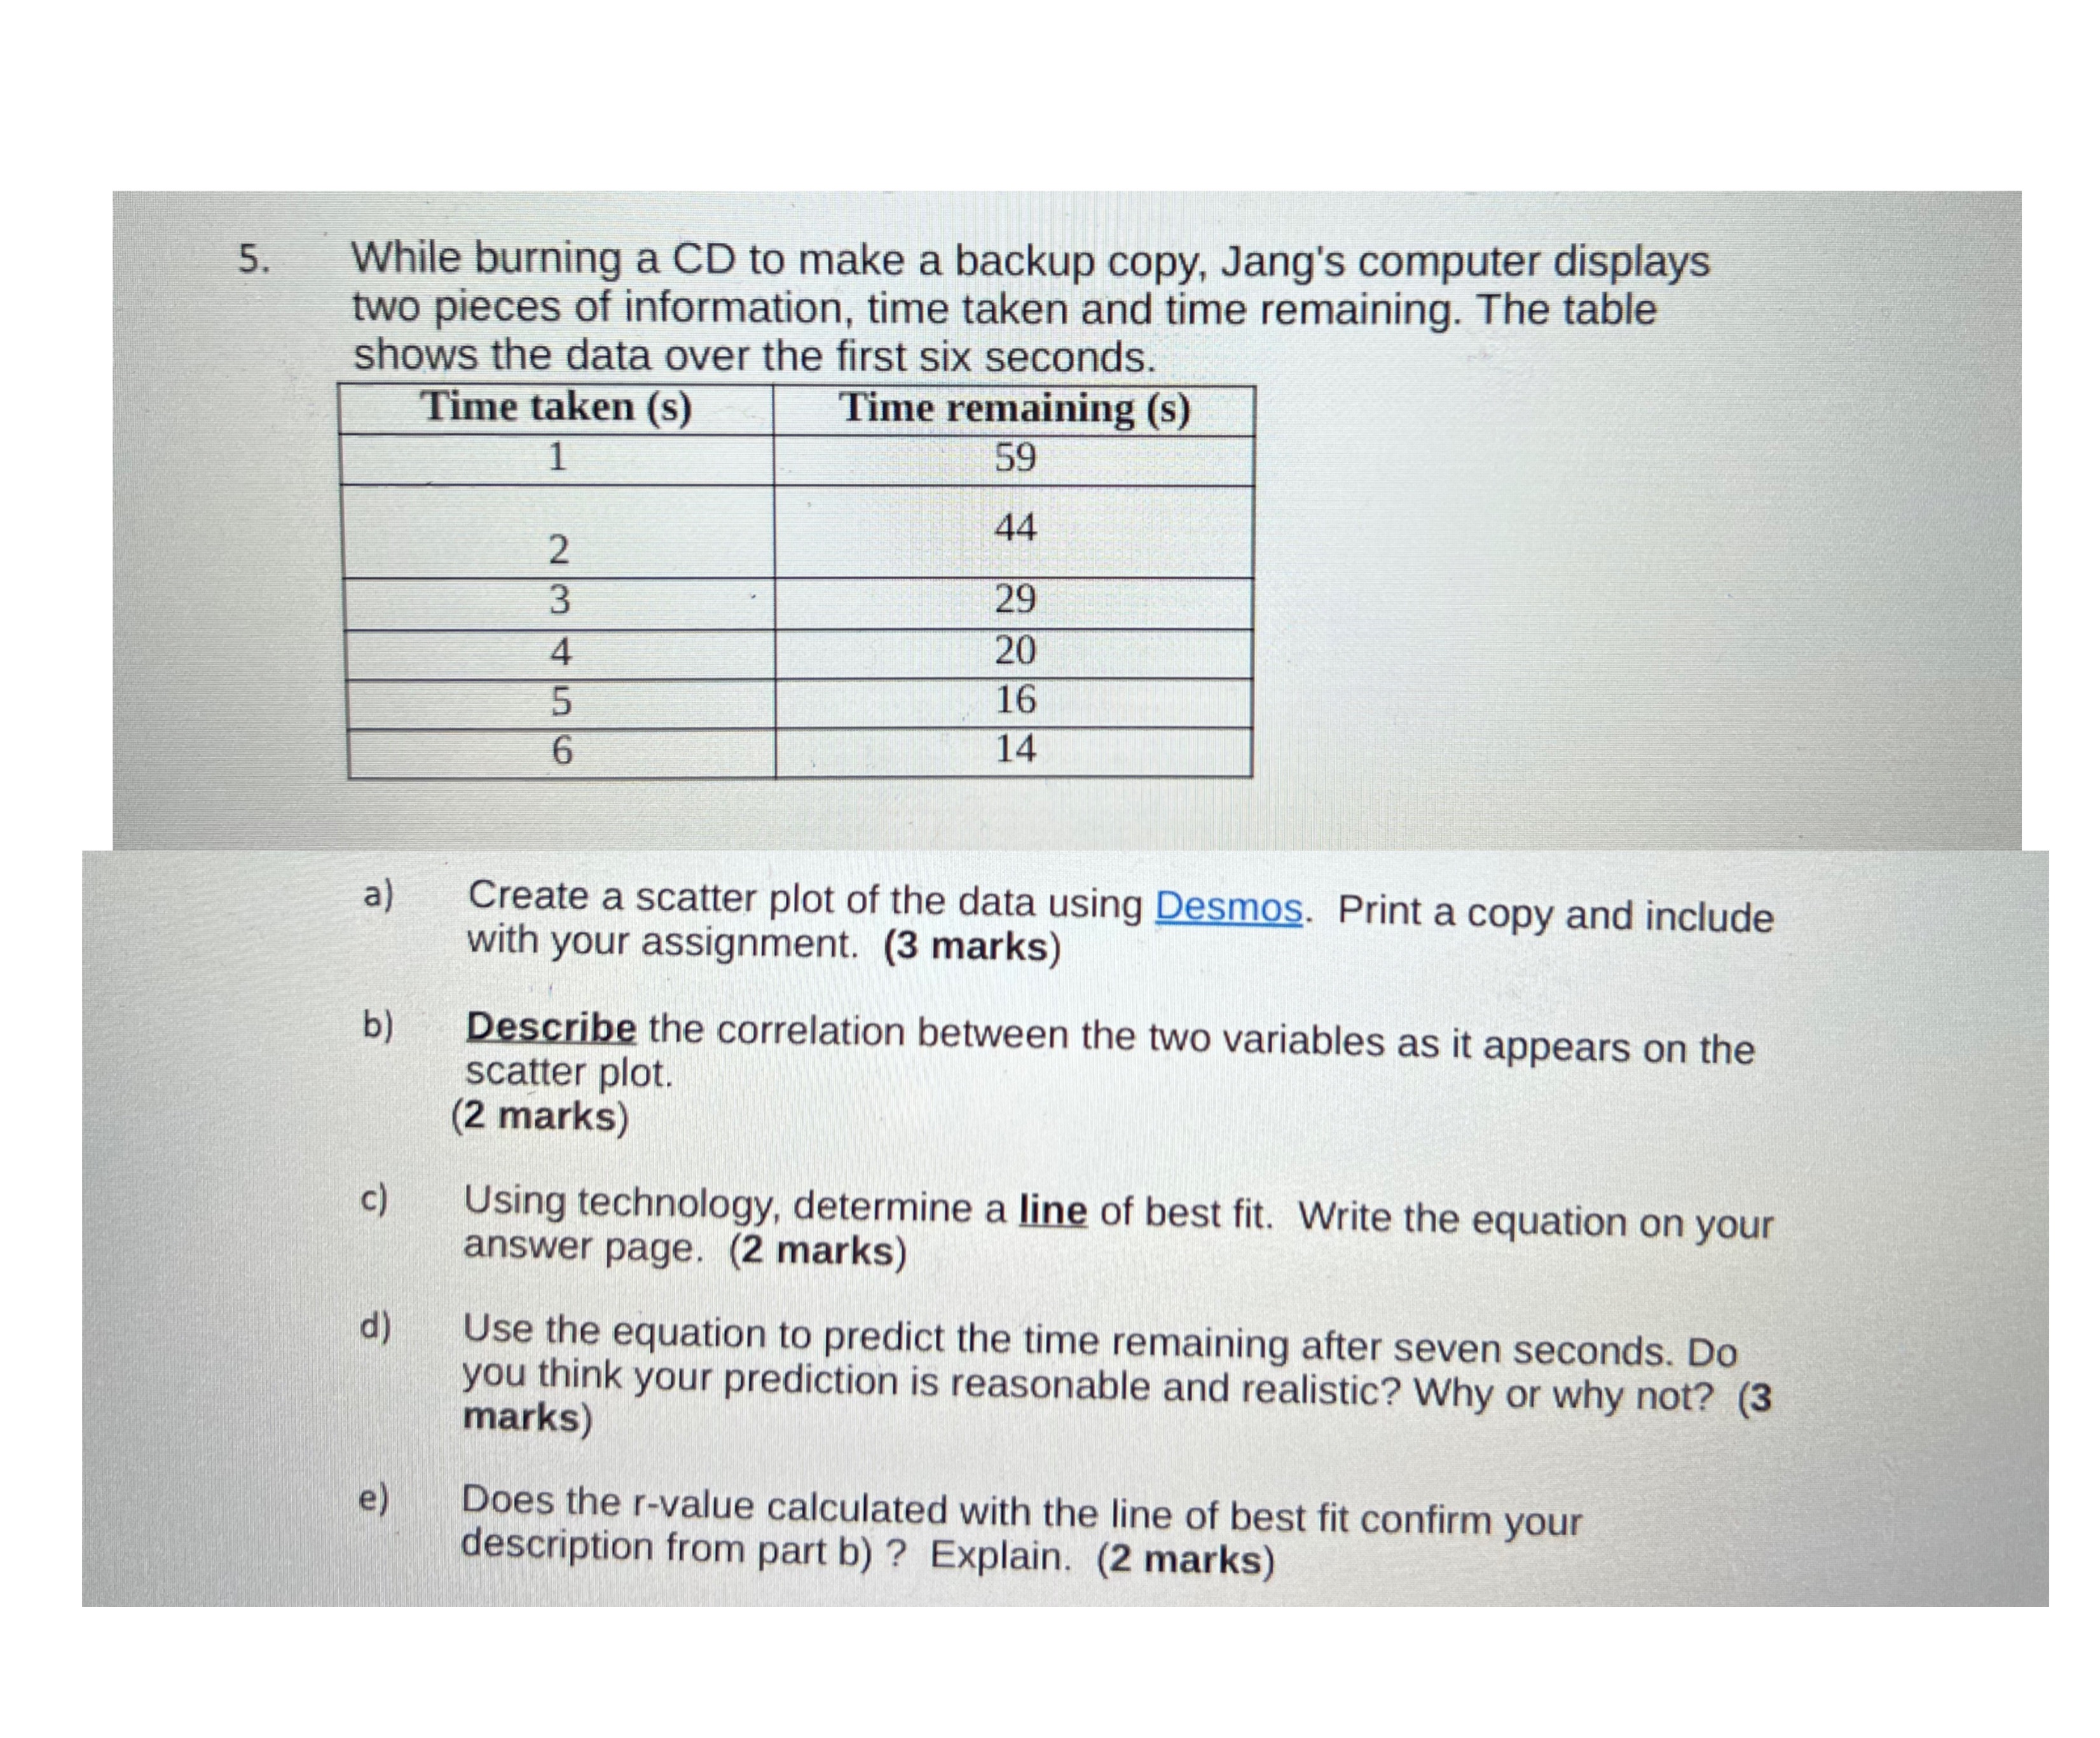
5 . While burning a CD to make a backup copy, Jang's computer displays two pieces of information, time taken and time remaining. The table shows the data over the first six seconds. Time taken (s) Time remaining (s) 1 59 44 W N 29 20 16 14 a) Create a scatter plot of the data using Desmos. Print a copy and include with your assignment. (3 marks) b ) Describe the correlation between the two variables as it appears on the scatter plot. (2 marks) c) Using technology, determine a line of best fit. Write the equation on your answer page. (2 marks) d) Use the equation to predict the time remaining after seven seconds. Do you think your prediction is reasonable and realistic? Why or why not? (3 marks) e) Does the r-value calculated with the line of best fit confirm your description from part b) ? Explain. (2 marks)
Step by Step Solution
There are 3 Steps involved in it

Get step-by-step solutions from verified subject matter experts