

Question: Margin Analysis Being able to calculate a healthy Margin Analysis will help the Research & Development Department understand how to change the cost of material
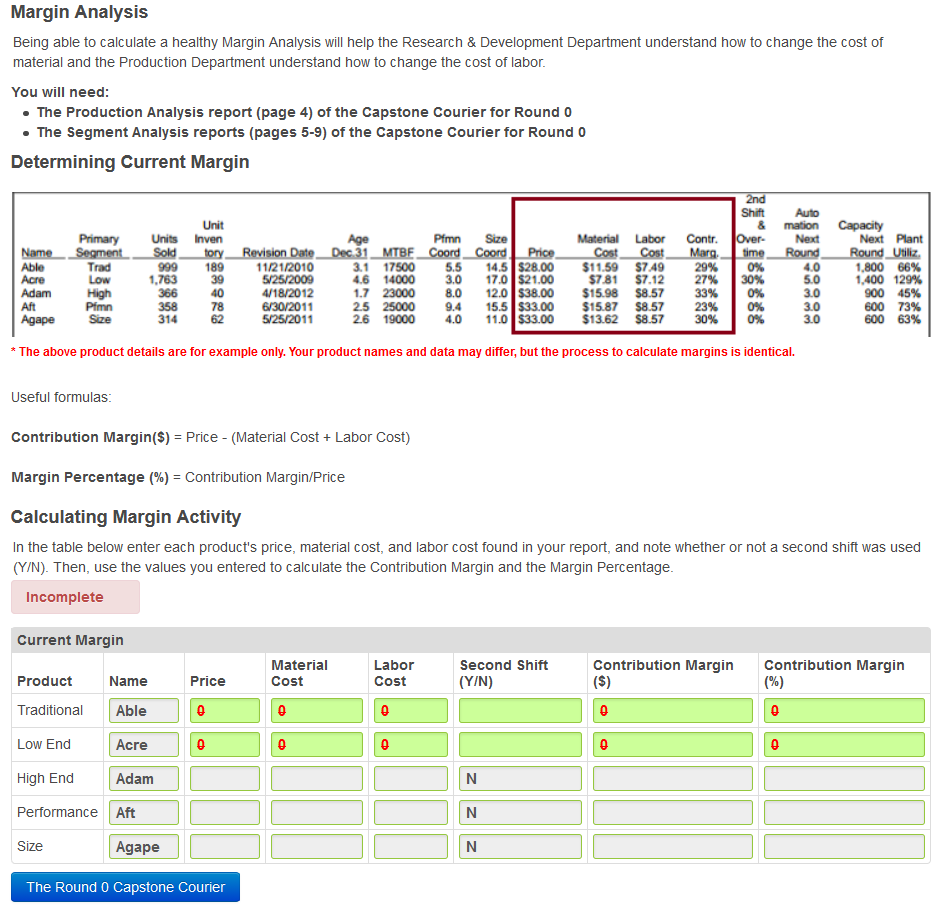
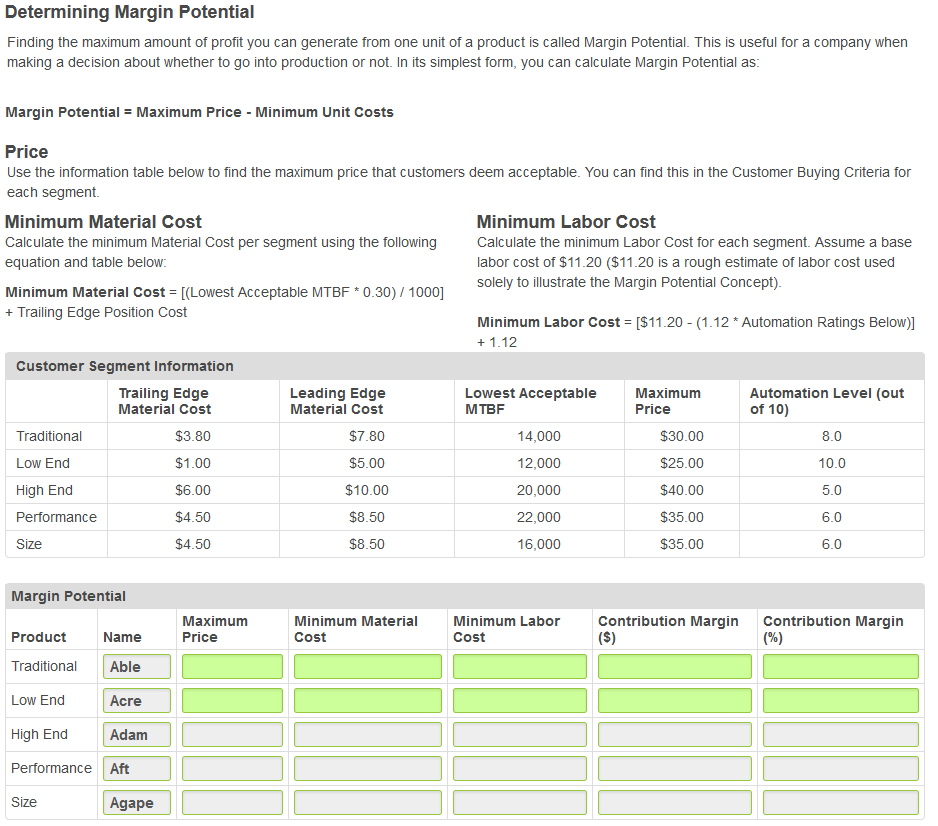
Margin Analysis Being able to calculate a healthy Margin Analysis will help the Research & Development Department understand how to change the cost of material and the Production Department understand how to change the cost of labor. You will need: The Production Analysis report (page 4) of the Capstone Courier for Round 0 The Segment Analysis reports (pages 5-9) of the Capstone Courier for Round 0 Determining Current Margin 2nd Shift Auto mation Next Round 4.0 5.0 3.0 3.0 3.0 Capacity Next Plant Round Utiliz 1,800 66% 1,400 129% 900 45% 600 73% 600 Unit Contr. Over time 0% 30% Units Inven Sold 999 1,763 366 358 314 Primary Segment Trad Age Pfmn Size Material Labor tory 189 39 Revision Date__ Dec 31_MTBF_Coord Coord 11/21/2010 5/25/2009 4/18/2012 6/30/2011 5/25/2011 Name Able Acre Price Cost Cost $11.59 $7.49 $7.81 Marg 29% 27% 33% 23% 30% 5.5 14.5 $28.00 3.0 17.0 $21.00 3.1 17500 4.6 14000 1.7 23000 2.5 25000 2.6 19000 $7.12 Low 12.0 $38.00 High Pimn Size 40 78 62 8.0 $15.98 $8.57 0% 0% 0% Adam Aft 15.5 $33.00 9.4 $15.87 $8.57 11.0 $33.00 Ag 4.0 $13.62 $8.57 63% *The above product details are for example only. Your product names and data may differ, but the process to calculate margins is identical. Useful formulas: Contribution Margin(S) Price - (Material Cost Labor Cost) Margin Percentage (%) Contribution Margin/Price Calculating Margin Activity In the table below enter each product's price, material cost, and labor cost found in your report, and note whether or not a second shift was used (Y/N). Then, use the values you entered to calculate the Contribution Margin and the Margin Percentage Incomplete Current Margin Contribution Margin (S) Contribution Margin (%) Material Labor Second Shift Product Name Price Cost Cost (Y/N) Traditional Able 0 0 0 Low End Acre 0 0 High End Adam N Performance Aft N Size Agape N The Round 0 Capstone Courier Determining Margin Potential Finding the maximum amount of profit you can generate from one unit of a product is called Margin Potential. This is useful for a company when making a decision about whether to go into production or not. In its simplest form, you can calculate Margin Potential as: Margin Potential = Maximum Price - Minimum Unit Costs Price Use the information table below to find the maximum price that customers deem acceptable. You can find this in the Customer Buying Criteria for each segment Minimum Material Cost Minimum Labor Cost Calculate the minimum Material Cost per segment using the following Calculate the minimum Labor Cost for each segment. Assume a base labor cost of $11.20 ($11.20 is a rough estimate of labor cost used equation and table below: solely to illustrate the Margin Potential Concept) Minimum Material Cost [(Lowest Acceptable MTBF*0.30) 1000] Trailing Edge Position Cost [S11.20 (1.12 * Automation Ratings Below)] Minimum Labor Cost 1.12 Customer Segment Information Automation Level (out of 10) Lowest Acceptable Trailing Edge Material Cost Leading Edge Material Cost aximum BF Price $3.80 $7.80 $30.00 Traditional 14,000 8.0 $1.00 $5.00 $25.00 10.0 Low End 12,000 $6.00 $10.00 $40.00 High End 20,000 5.0 $4.50 $8.50 $35.00 Performance 22,000 6.0 Size $4.50 $8.50 $35.00 6.0 16,000 Margin Potential Contribution Margin (S) Contribution Margin (%) Maximum Minimum Material Minimum Labor Product Name Price Cost Cost Traditional Able Low End Acre High End Adam Performance Aft Size Agape Margin Analysis Being able to calculate a healthy Margin Analysis will help the Research & Development Department understand how to change the cost of material and the Production Department understand how to change the cost of labor. You will need: The Production Analysis report (page 4) of the Capstone Courier for Round 0 The Segment Analysis reports (pages 5-9) of the Capstone Courier for Round 0 Determining Current Margin 2nd Shift Auto mation Next Round 4.0 5.0 3.0 3.0 3.0 Capacity Next Plant Round Utiliz 1,800 66% 1,400 129% 900 45% 600 73% 600 Unit Contr. Over time 0% 30% Units Inven Sold 999 1,763 366 358 314 Primary Segment Trad Age Pfmn Size Material Labor tory 189 39 Revision Date__ Dec 31_MTBF_Coord Coord 11/21/2010 5/25/2009 4/18/2012 6/30/2011 5/25/2011 Name Able Acre Price Cost Cost $11.59 $7.49 $7.81 Marg 29% 27% 33% 23% 30% 5.5 14.5 $28.00 3.0 17.0 $21.00 3.1 17500 4.6 14000 1.7 23000 2.5 25000 2.6 19000 $7.12 Low 12.0 $38.00 High Pimn Size 40 78 62 8.0 $15.98 $8.57 0% 0% 0% Adam Aft 15.5 $33.00 9.4 $15.87 $8.57 11.0 $33.00 Ag 4.0 $13.62 $8.57 63% *The above product details are for example only. Your product names and data may differ, but the process to calculate margins is identical. Useful formulas: Contribution Margin(S) Price - (Material Cost Labor Cost) Margin Percentage (%) Contribution Margin/Price Calculating Margin Activity In the table below enter each product's price, material cost, and labor cost found in your report, and note whether or not a second shift was used (Y/N). Then, use the values you entered to calculate the Contribution Margin and the Margin Percentage Incomplete Current Margin Contribution Margin (S) Contribution Margin (%) Material Labor Second Shift Product Name Price Cost Cost (Y/N) Traditional Able 0 0 0 Low End Acre 0 0 High End Adam N Performance Aft N Size Agape N The Round 0 Capstone Courier Determining Margin Potential Finding the maximum amount of profit you can generate from one unit of a product is called Margin Potential. This is useful for a company when making a decision about whether to go into production or not. In its simplest form, you can calculate Margin Potential as: Margin Potential = Maximum Price - Minimum Unit Costs Price Use the information table below to find the maximum price that customers deem acceptable. You can find this in the Customer Buying Criteria for each segment Minimum Material Cost Minimum Labor Cost Calculate the minimum Material Cost per segment using the following Calculate the minimum Labor Cost for each segment. Assume a base labor cost of $11.20 ($11.20 is a rough estimate of labor cost used equation and table below: solely to illustrate the Margin Potential Concept) Minimum Material Cost [(Lowest Acceptable MTBF*0.30) 1000] Trailing Edge Position Cost [S11.20 (1.12 * Automation Ratings Below)] Minimum Labor Cost 1.12 Customer Segment Information Automation Level (out of 10) Lowest Acceptable Trailing Edge Material Cost Leading Edge Material Cost aximum BF Price $3.80 $7.80 $30.00 Traditional 14,000 8.0 $1.00 $5.00 $25.00 10.0 Low End 12,000 $6.00 $10.00 $40.00 High End 20,000 5.0 $4.50 $8.50 $35.00 Performance 22,000 6.0 Size $4.50 $8.50 $35.00 6.0 16,000 Margin Potential Contribution Margin (S) Contribution Margin (%) Maximum Minimum Material Minimum Labor Product Name Price Cost Cost Traditional Able Low End Acre High End Adam Performance Aft Size Agape
Step by Step Solution
There are 3 Steps involved in it

Get step-by-step solutions from verified subject matter experts