Question: these next pictures are for your refrence Margin Analysis Being able to calculate a healthy Margin Analysis will help the Research & Development Department understand
these next pictures are for your refrence
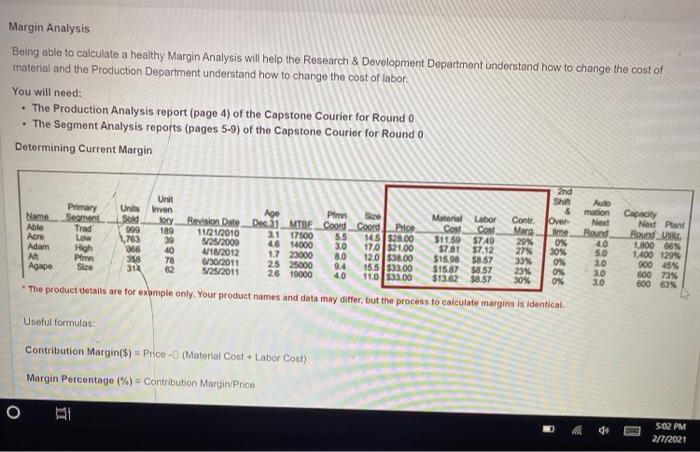
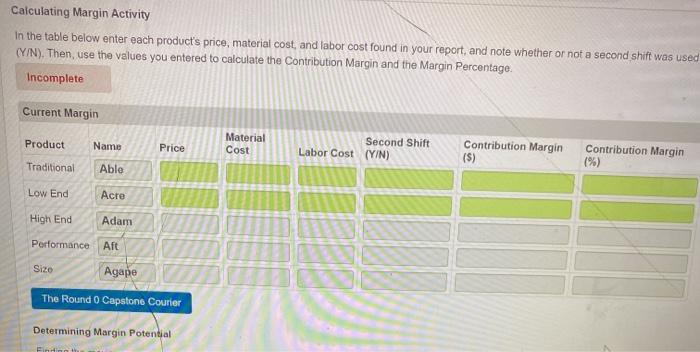
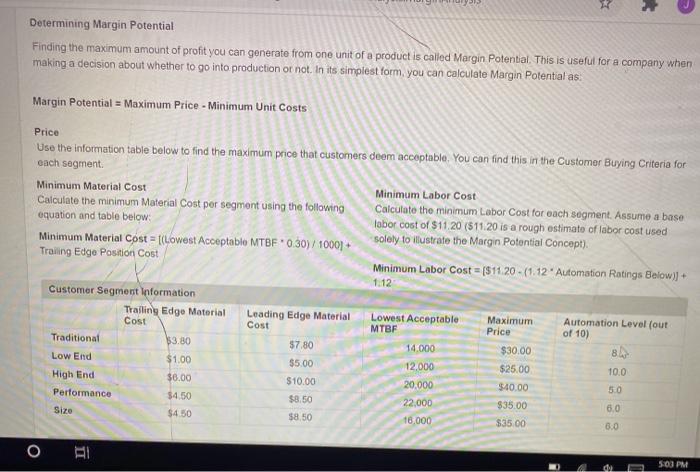
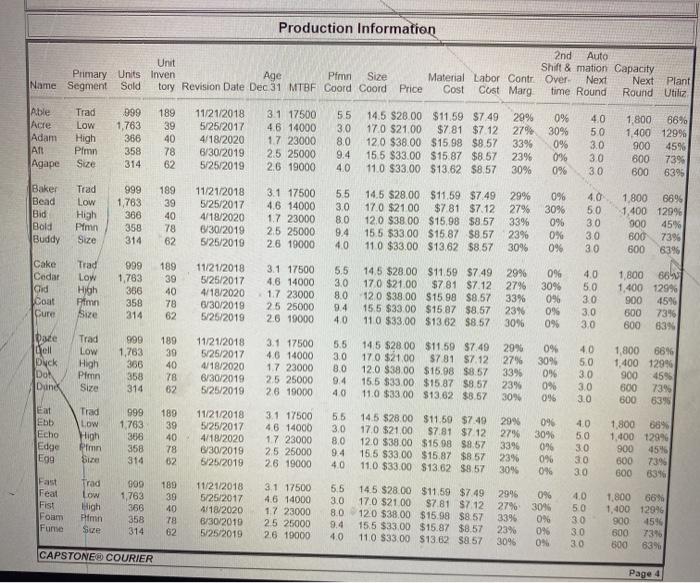
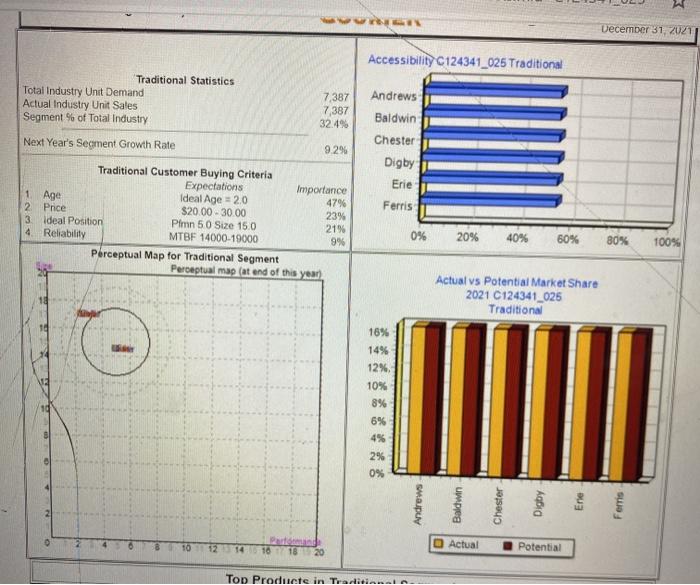
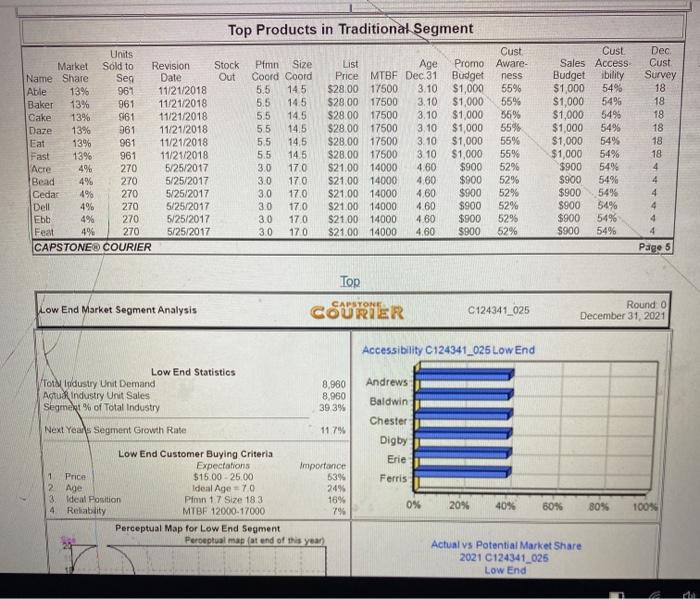
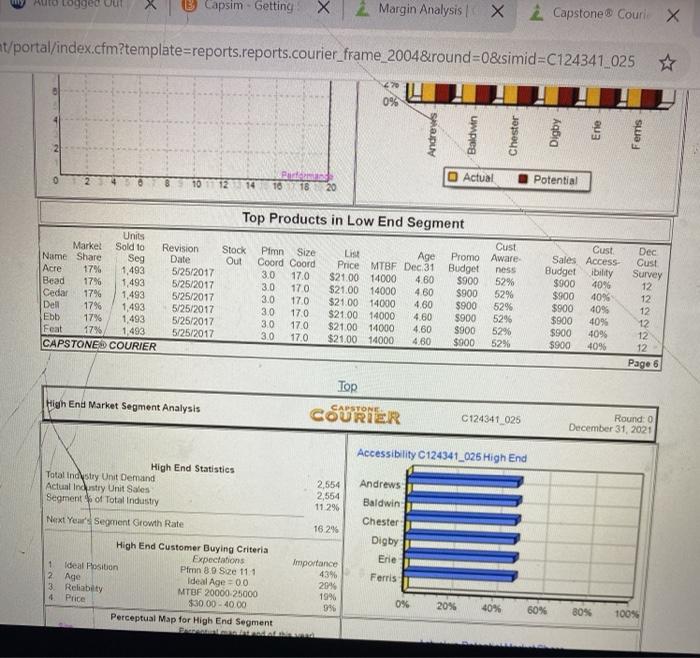
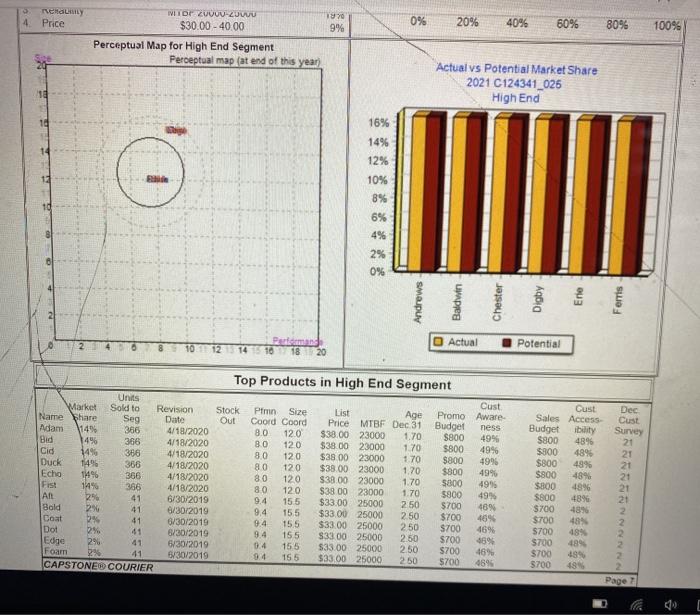
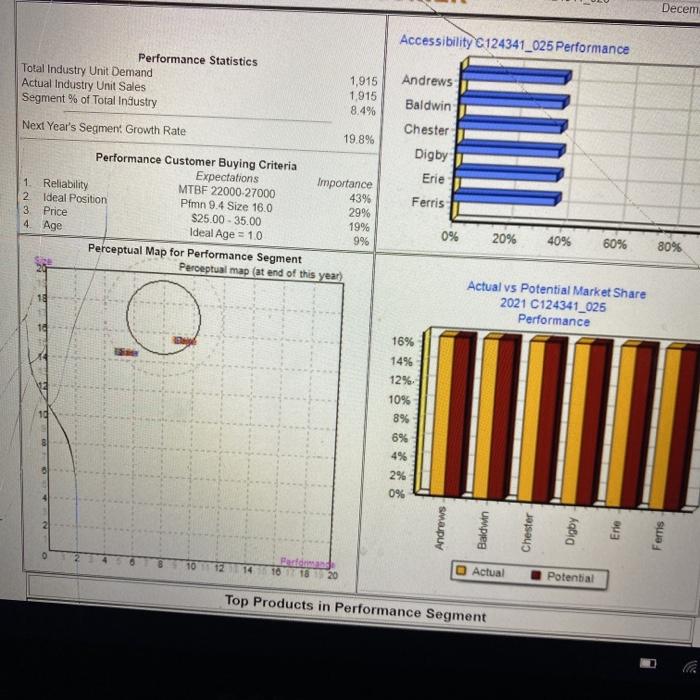
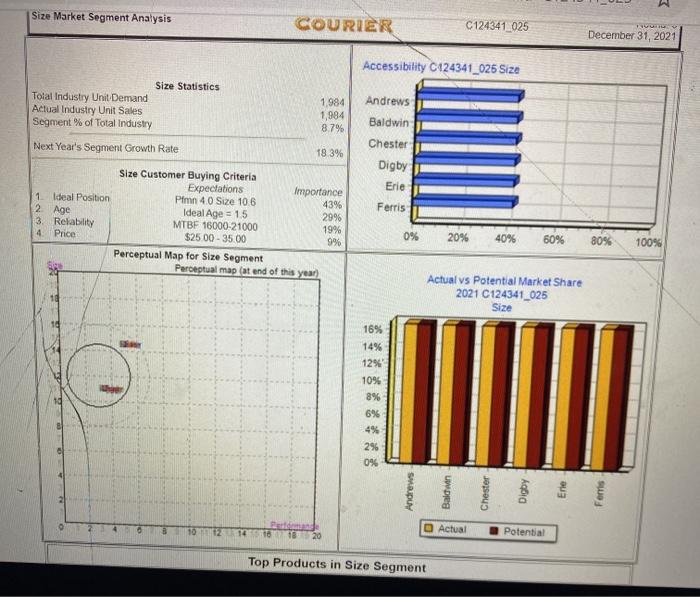
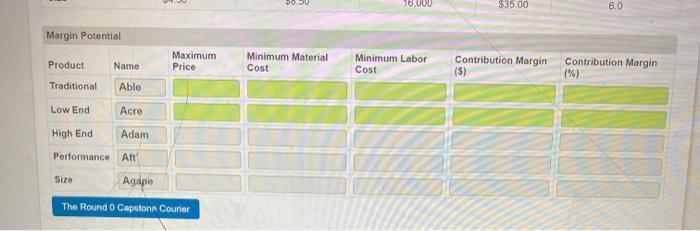
Margin Analysis Being able to calculate a healthy Margin Analysis will help the Research & Development Department understand how to change the cost of material and the Production Department understand how to change the cost of labor. You will need: The Production Analysis report (page 4) of the Capstone Courier for Round 0 The Segment Analysis reports (pages 5-9) of the Capstone Courier for Round 0 Determining Current Margin 2nd Shirt Unit Inven Primary Name Able Acre Adam Art Agape Trad Low High Pin Sie Units Sold 999 1,763 366 358 314 189 39 40 78 Age Plim Sie Revision Date Dec.31_MTBE Coord_Coord Price 11/21/2010 2.1 17500 5.5 145528.00 5/25/2000 46 14000 3.0 17,0 $21.00 10/2012 17 23000 8,0 120538.00 30/2011 25 25000 94 155 $33.00 V25/2011 26 19000 40 11.0533.00 Material Labor Cost Cost $11.50 $740 37.81 37.12 $15.98 $8.57 $15.87 $8.57 $13.62 $8.57 Contr Marg 29% 27% 30% 23% 30% Over fime Os 30% 0% ON OX Auto mation Next Round 40 5.0 20 10 Capacity Next Plant Round_ 11000 1,400 1291 SOO 45% 600 73 600 60 10 * The product details are for exhmple only. Your product names and data may differ, but the process to calculate margins is identical. Useful formulas Contribution Margin(5) = Price - (Material Cost + Labor Cost) Margin Percentage (%) = Contribution Margin Price O 502 PM 2/1/2021 Calculating Margin Activity In the table below enter each product's price, material cost, and labor cost found in your report, and note whether or not a second shift was used (Y/N). Then, use the values you entered to calculate the Contribution Margin and the Margin Percentage. Incomplete Current Margin Product Name Price Material Cost Second Shift Labor Cost (Y/N) Contribution Margin ($) Contribution Margin (%) Traditional Able Low End Acre High End Adam Performance Aft Size Agape The Round 0 Capstone Courier Determining Margin Potential Findinn Determining Margin Potential Finding the maximum amount of profit you can generate from one unit of a product is called Margin Potential. This is useful for a company when making a decision about whether to go into production or not. In its simplest form, you can calculate Margin Potential as. Margin Potential = Maximum Price - Minimum Unit Costs Price Use the information table below to find the maximum price that customers deem acceptable. You can find this in the Customer Buying Criteria for each segment Minimum Material Cost Minimum Labor Cost Calculate the minimum Material Cost per segment using the following Calculate the minimum Labor Cost for each segment. Assume a base equation and table below: tobor cost of $11.20 ($11.20 is a rough estimate of labor cost used Minimum Material Cost = f(Lowest Acceptable MTBF0.30) / 10001 solely to illustrate the Margin Potential Concept). Trailing Edge Position Cost Minimum Labor Cost = ($11.20 - (1.12 Automation Ratings Below)] + 1.12 Customer Segment Information Tralling Edge Material Leading Edge Material Lowest Acceptable Maximum Automation Level (out Cost Cost MTBF Price of 10) Traditional $3.80 57.80 14.000 $30.00 8 Low End $1.00 $5.00 12,000 $25.00 10.0 High End 36.00 $10.00 20.000 $40.00 50 Performance $4.50 $8.50 22.000 $35.00 Size $4.50 $8.50 16,000 $35.00 8.0 6.0 O 500 PM 76.000 $35.00 6.0 Margin Potential Maximum Price Product Name Minimum Material Cost Minimum Labor Cost Contribution Margin (5) Contribution Margin (%) Traditional Ablo Low End Acre High End Adam Performance Alt Size Agapo The Round 0 Caputon Courier Production Information Unit Primary Units Inven Age Pimn Size Name Segment Sold tory Revision Date Dec 31 MTBF Coord Coord Price 2nd Auto Shift & mation Capacity Material Labor Contr. Over Next Next Plant Cost Cost Marg time Round Round Utiliz Able Acre Adam AT Agape Trad Low High Pimn 40 5.0 999 1,763 366 358 314 189 39 40 78 62 11/21/2018 5/25/2017 4/18/2020 6/30/2019 5/25/2019 3.1 17500 4.6 14000 1.7 23000 25 25000 2.6 19000 55 30 80 9.4 40 14.5 $28.00 $11.59 $749 17,0 $21.00 $7.81 $7 12 120 $38.00 $15.99 $8.57 155 $33.00 $15.87 $8.57 11.0 $33.00 $13.62 $8.57 29% 0% 27% 30% 33% 0% 23% 0% 30% 0% 1,800 86% 1 400 129% 900 45% 600 7396 6395 Size 30 130 600 29% Baker Bead Bid Bold Buddy Trad LOW High Pimn Size 999 1,763 366 358 314 189 39 40 78 62 11/21/2018 5/25/2017 4/18/2020 6/30/2019 5/25/2019 3.1 17500 46 14000 1.7 23000 25 25000 26 19000 5.5 3.0 8.0 9.4 4.0 14,5 $28.00 $11.59 $7 49 17,0 $21.00 $781 $7.12 12.0 $38.00 $15.98 $8.57 15.5 $33.00 $15.87 $8.57 110 $33.00 $13.62 $8.57 27% 33% 23% 30% 096 30% 0% 0% 0% 4.0 50 30 30 30 1.800 66% 1,400 129% 900 45% 600 7399 600 63% 189 999 1,783 Cake Cedar Grid Coat Cure Trad Low High pim Size 356 39 40 78 62 11/21/2018 5/25/2017 4/18/2020 6/30/2019 5/25/2019 3.1 17500 46 14000 17 23000 25 25000 26 19000 5.5 3.0 80 9.4 40 14.5 $28.00 $11.59 $7.49 29% 170 $21.00 $781 $7.12 27% 12 0 $38.00 $15.98 $8.57 33% 15.5 $33.00 $15.07 $8.57 23% 110 $33.00 $13.62 $8.57 30% 358 314 0% 30% 0% 0% 0% 4.0 5.0 30 30 3.0 1.800 669 1,400 129% 900 4596 500 7396 600 63% bate Trad LOW High ell 88$ $8885 38655 67685 68688 55666 999 1,763 356 358 314 lolyck 189 39 40 78 62 11/21/2018 5/25/2017 4/18/2020 6/30/2019 5/25/2019 3.1 17500 4.6 14000 1.7 23000 25 25000 20 19000 5.5 3.0 80 9.4 4.0 Doh Piren 14 5 $28.00 $11.59 $7.49 29% 170 $21.00 S781 $7.12 27% 120 $38.00 $15.98 $8.57 33% 155 $33.00 $15.87 $8.57 23% 11.0 $33.00 $13.62 $3.57 3096 0% 30% 0% 0% 0% 1,800 68% 1.400 129% 900 4595 600 73% 600 6398 Dune Size 3.0 3.0 096 Eat Ebb Echo Edge Egg Trad Low High Proin Size 999 1.763 356 358 314 189 39 40 78 62 11/21/2018 5/25/2017 4/18/2020 6/30/2019 6/25/2019 30% 31 17500 46 14000 17 23000 25 25000 26 19000 5.5 3.0 80 9.4 4.0 14,5 $28.00 $11.50 $7.49 170 $21.00 $7.81 $7 12 120 $38.00 $15.98 $8.57 15.5 $33.00 $15.87 $857 11.0 $33.00 $13.62 $8.57 299 27% 33% 23% 30% 0% 0% 0% 40 5.0 3.0 30 30 1.800 68% 1.400 12996 900 45% 600 739 600 339 Fast Feat Fist Trad LOW High Pimn Suze 900 1,763 366 358 314 189 39 40 78 62 Foam Fume 11/21/2018 5/25/2017 4/18/2020 8/30/2010 5/25/2019 3.1 17500 4.6 14000 17 23000 25 25000 26 10000 5.5 3.0 8.0 9.4 4.0 145 $28.00 $11.59 $7.49 17,0 $21.00 97.81 $712 120 $38.00 $15.98 $8.57 15.5 $33.00 $15.87 $8.57 110 $33.00 $13.82 $8.57 2996 27% 3396 23% 3096 0% 30% 0% 0% 0% 5.0 30 3.0 30 1.800 66% 1,400 12996 900 4596 600 7396 500 63% CAPSTONE COURIER Page 4 December 31, 2021 Accessibility C124341_025 Traditional Traditional Statistics Total Industry Unit Demand Actual Industry Unit Sales Segment % of Total Industry 7,387 7,387 32.4% Next Year's Secment Growth Rate 9.296 Andrews Baldwin Chester Digby Erie Ferris Traditional Customer Buying Criteria Expectations Importance 1 Age Ideal Age = 20 47% 2 Price $20.00 - 30.00 23% 3 Ideal Position Pimn 5 0 Size 15.0 21% 4. Reliability MTBF 14000-19000 9% Perceptual Map for Traditional Segment Perceptual map (at end of this year 0% 20% 40% 60% 80% 100% Actual vs Potential Market Share 2021 C124341_025 Traditional 16% 14% 12% 10% 8% 6% 4% 2% 0% Actual 1410 Potential 18 20 Top Producte in Tradition 961 Top Products in Traditional Segment Units Cust Market Sold to Revision Stock Pfmn Size List Age Promo Aware- Name Share Seg Date Out Coord Coord Price MTBF Dec 31 Budget ness Able 13% 961 11/21/2018 5.5 145 $28.00 17500 3.10 $1,000 55% Baker 13% 11/21/2018 5.5 14.5 $28.00 17500 3.10 $1,000 55% Cake 13% 961 11/21/2018 5.5 14.5 $28.00 17500 3.10 $1,000 56% Daze 13% 961 11/21/2018 55 14,5 $28.00 17500 3.10 $1,000 55% Eat 13% 961 11/21/2018 5.5 14.5 $28.00 17500 3.10 $1,000 55% Fast 13% 961 11/21/2018 5.5 14.5 $28.00 17500 3 10 $1,000 55% Acre 4% 270 5/25/2017 30 170 $21,00 14000 4.60 $900 52% Bead 4% 270 5/25/2017 170 $21.00 14000 4.60 $900 529 Cedar 4% 270 5/25/2017 30 170 $21.00 14000 4.60 $900 52% Dell 4% 270 5/25/2017 30 170 $2100 14000 460 $900 52% Ebb 49 270 5/25/2017 30 170 $21.00 14000 4.60 $900 5295 Feat 4% 270 5/25/2017 30 170 $21.00 14000 4.60 5900 52% CAPSTONE COURIER Cust Sales Access Budget ibility $1,000 54% $1,000 54% $1,000 54% $1,000 549 $1,000 54% $1,000 54% $900 54% $900 54% $900 54% $900 54% $900 54% $900 54% Dec Cust Survey 18 18 18 18 18 18 4 4 4 4 Page 5 Top CAPSYONE Low End Market Segment Analysis COURIER C124341_025 Round 0 December 31, 2021 Accessibility C124341_025 Low End Andrews Low End Statistics Tot Ildustry Unit Demand Agtud industry Unit Sales Segment of Total Industry 8,960 8,960 39 3% Baldwin Chester Next Years Segment Growth Rate 11.7% Digby Erie Ferris Age Low End Customer Buying Criteria Expectations Importance 1 Price $15.00 - 25.00 53% 2 Ideal Age -70 24% 3 Ideal Position Pfmn 1 7 Size 183 16% 4 Reliability MTBF 12000-17000 79 Perceptual Map for Low End Segment Perceptual map at end of this year) 0% 20% 40% 60% 80% 100N Actual vs Potential Market Share 2021 C124341_025 Low End da Logged Capsim. Getting Margin Analysis X Capstone CouriX at/portal/index.cfm?template=reports.reports.courier_frame_2004&round=0&simid=C124341_025 0% Andrews Baldwin Chester O Actual Potential 14 16 18 20 Units Market Sold to Revision Name Share Seg Date Acre 17% 1,493 5/25/2017 Bead 17% 1,493 5/25/2017 Cedar 17% 1,493 5/25/2017 Den 17% 1,493 5/25/2017 Ebb 17% 1,493 5/25/2017 Feat 17% 1,493 5/25/2017 CAPSTONE COURIER Top Products in Low End Segment Cust Stock Pimn Size List Age Promo Aware Out Coord Coord Price MTBF Dec 31 Budget ness 30 170 $21.00 14000 4.60 $900 52% 30 170 $21.00 14000 4.60 $900 52% 3.0 17.0 $21.00 14000 4.60 $900 52% 30 170 $2100 14000 4.60 $900 52% 30 17.0 $21.00 14000 4.60 8900 52% 3.0 17.0 $21.00 14000 4.60 $900 52% Cust Sales Access Budget ibility $900 40% $900 40% $900 40% $900 40% $900 40% $900 40% Dec Cust Survey 12 12 12 12 12 12 Page 6 Top High End Market Segment Analysis CAPSTONE COURIER C124341_025 Round: December 31, 2021 Accessibility C124341_025 High End High End Statistics Total Industry Unit Demand Actual Industry Unit Sales Segment of Total Industry 2,554 2,554 11 296 Next Year Segment Growth Rate 16.2% Andrews Baldwin Chester Digby Erle Ferris High End Customer Buying Criteria Expectations 1 Ideal Position Pfmn 89 Size 111 2 Age Ideal Age=00 3 Reliabety MTBF 20000 25000 4 Price $30.00 - 40.00 Perceptual Map for High End Segment BA Importance 43% 20% 19% 9% 0% 20% 40% 60% 80% 100% rvenauly 4 Price 0% 20% 4096 60% 8096 100% INI DE ZUVUV-20W 1970 $30.00 - 40.00 9% Perceptual Map for High End Segment Perceptual map (at end of this year Actual vs Potential Market Share 2021 C124341_026 High End 16% 1496 12% 10% 8% 6% 4% 2% 0% -SMO Per 1820 O Actual Potential 14% 368 $800 Top Products in High End Segment Units Market Sold to Revision Stock Cust Pimn Size List Name Share Age Promo Aware Seg Date Out Coord Coord Price MTBF Dec 31 Adam ness 1145 Budget 366 4/18/2020 8.0 120 $38.00 23000 1.70 $800 Bid 14% 366 49% 4/18/2020 80 120 $38.00 23000 1.70 $800 49% Cid 388 4/18/2020 80 120 $38 00 23000 1.70 Duck 14% 4996 4/18/2020 80 $38.00 23000 120 1.70 1496 Echo $800 366 4/18/2020 49% 80 120 $38.00 23000 1.70 5800 Fist 14% 49% 366 4/18/2020 80 120 $38 00 23000 1.70 AR 29 $800 49% 41 6/30/2019 9.4 15.5 $33.00 25000 250 Bold 2 $700 48% 41 8/30/2019 9.4 15.5 $33.00 25000 Coat % 250 $700 46% 41 6/30/2019 9.4 155 Dot $33.00 25000 2% 250 41 $700 46% 8/30/2019 9.4 155 S33 00 25000 Edge 296 41 250 469 6/30/2019 155 $33.00 25000 Foam 20% 2.50 41 $700 46% 5/30/2019 155 $33.00 25000 CAPSTONE COURIER $700 469 489 Cust Dec Sales Access Cust Budget ibility Survey $800 4896 21 $300 4896 21 $800 49% S800 $800 49% $800 48% $700 4896 $700 48% 5700 489 $700 489 $700 499 2 5700 48% 2 Page 7 NNNNNNN $700 250 Decem Accessibility C124341_025 Performance Performance Statistics Total Industry Unit Demand Actual Industry Unit Sales Segment % of Total Industry 1,915 1.915 8.4% Andrews Baldwin Next Year's Segment Growth Rate Chester 19.8% Digby Erie Ferris Performance Customer Buying Criteria Expectations Importance 1. Reliability MTBF 22000-27000 43% 2 Ideal Position Pfmn 9.4 Size 16.0 29% 3 Price $25.00 - 35.00 19% 4 Age Ideal Age = 10 9% Perceptual Map for Performance Segment Perceptual map (at end of this year) 0% 20% 40% 60% 80% Actual vs Potential Market Share 2021 C124341_025 Performance 16% 14% 12% 10% 8% 6% 4% 2% 0% o 14 1018 O Actual 20 Potential Top Products in Performance Segment Size Market Segment Analysis COURIER C124341_025 HAVU December 31, 2021 Accessibility C124341_025 Size Andrews Size Statistics Total Industry Unit Demand Actual Industry Unit Sales Segment % of Total Industry Next Year's Segment Growth Rate 1.984 1,984 8.7% Baldwin 18 3% Chester Digby Erie Ferris 1. Ideal Position 2. Age 3. Reliability 4 Price Size Customer Buying Criteria Expectations Importance Pfmn 40 Size 10.6 43% Ideal Age = 15 29% MTBF 16000-21000 19% $2500 - 35.00 9% Perceptual Map for Size Segment Perceptual map (at end of this year) 0% 20% 40% 60% 80% 100% Actual vs Potential Market Share 2021 C124341_025 Size 16% 14% 12% 10% 8% 6% 296 0% TO O Actual Potential Top Products in Size Segment