Question: Margin Analysis Margin Analysis Being able to calculate a healthy Margin Analysis will help the Research & Development Department understand how to change the cost
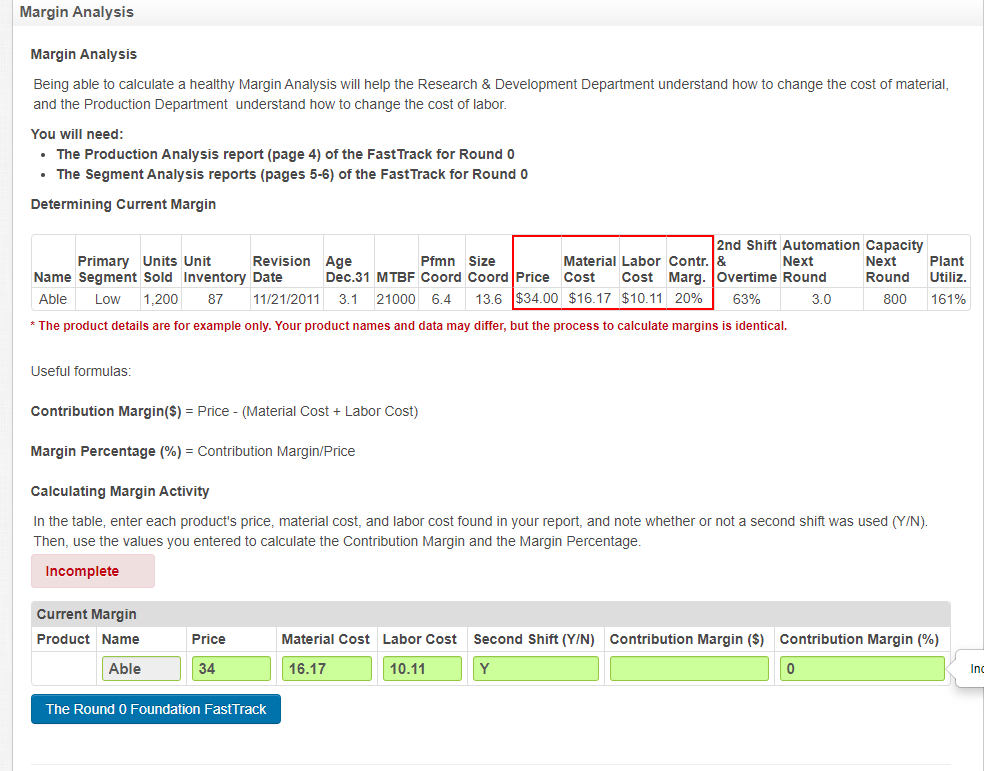
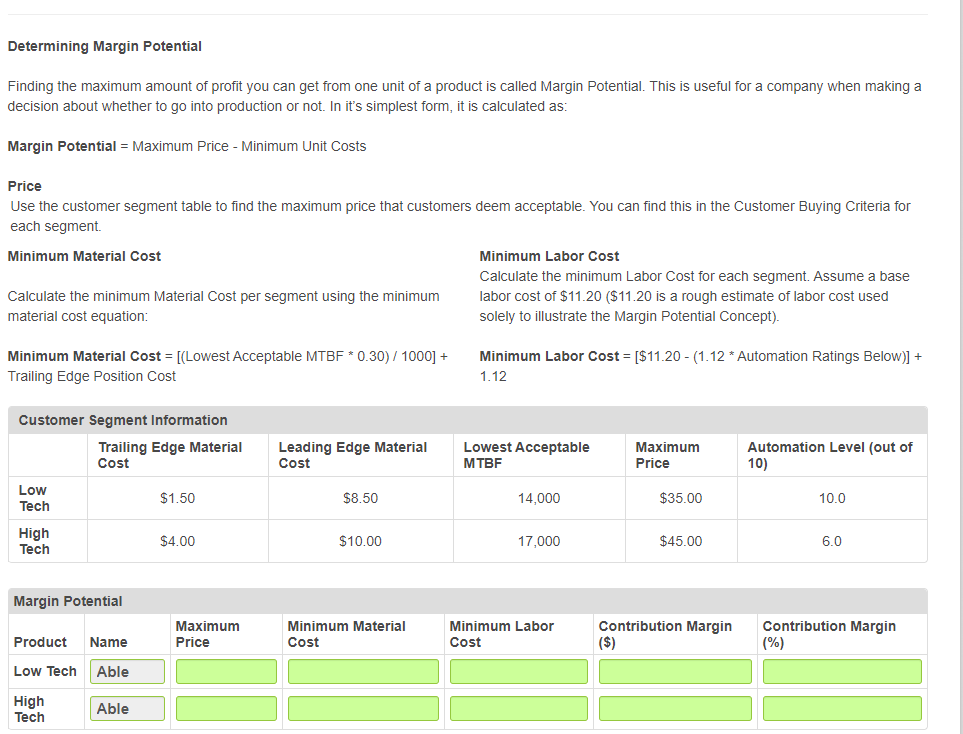
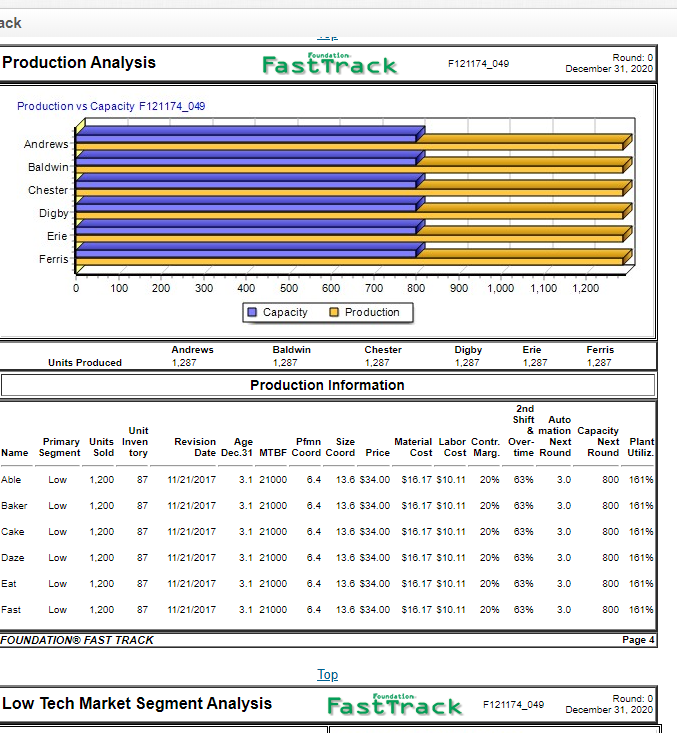
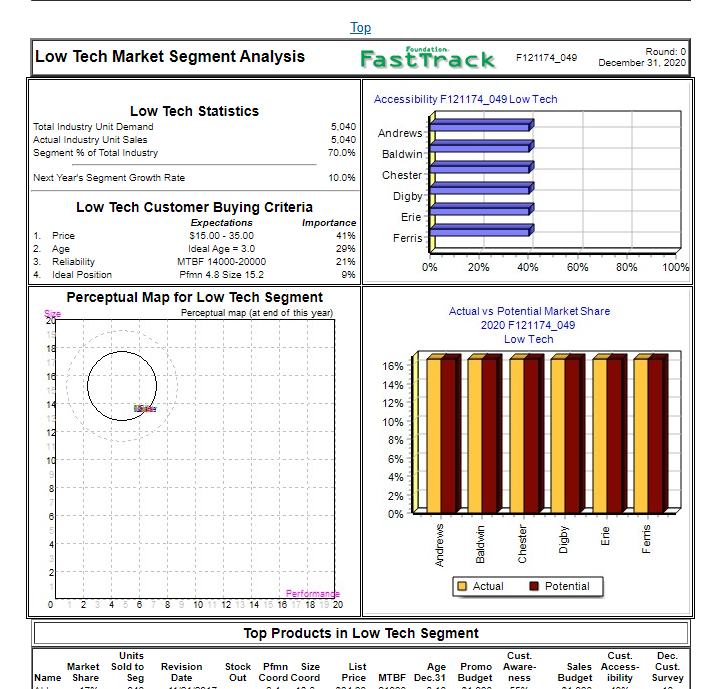
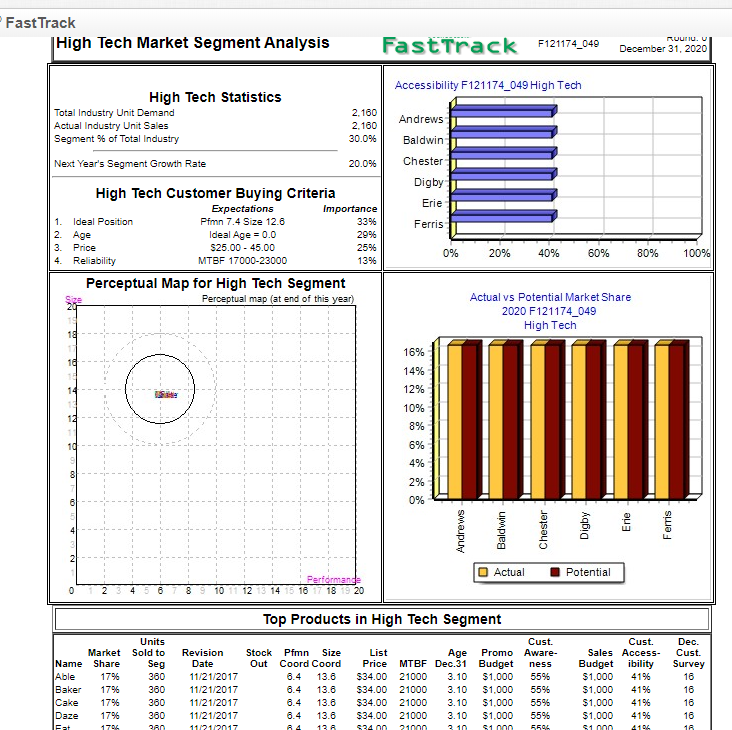
Margin Analysis Margin Analysis Being able to calculate a healthy Margin Analysis will help the Research & Development Department understand how to change the cost of material, and the Production Department understand how to change the cost of labor. You will need: The Production Analysis report (page 4) of the Fast Track for Round 0 The Segment Analysis reports (pages 5-6) of the Fast Track for Round 0 Determining Current Margin 2nd Shift Automation Capacity Primary Units Unit Revision Age Pfmn Size Material Labor Contr. & Next Next Plant Name Segment Sold Inventory Date Dec.31 MTBF Coord Coord Price Cost Cost Marg. Overtime Round Round Utiliz. Able Low 1,200 87 11/21/2011 3.1 21000 6.4 13.6 $34.00 $16.17 $10.11 20% 63% 3.0 800 161% * The product details are for example only. Your product names and data may differ, but the process to calculate margins is identical. Useful formulas: Contribution Margin($) = Price - (Material Cost + Labor Cost) Margin Percentage (%) = Contribution Margin/Price Calculating Margin Activity In the table, enter each product's price, material cost, and labor cost found in your report, and note whether or not a second shift was used (Y/N). Then, use the values you entered to calculate the Contribution Margin and the Margin Percentage. Incomplete Current Margin Product Name Price Material Cost Labor Cost Second Shift (Y/N) Contribution Margin ($) Contribution Margin (%) | Y 0 Able 34 16.17 10.11 Inc The Round 0 Foundation FastTrack Determining Margin Potential Finding the maximum amount of profit you can get from one unit of a product is called Margin Potential. This is useful for a company when making a decision about whether to go into production or not. In it's simplest form, it is calculated as: Margin Potential = Maximum Price - Minimum Unit Costs Price Use the customer segment table to find the maximum price that customers deem acceptable. You can find this in the Customer Buying Criteria for each segment. Minimum Material Cost Minimum Labor Cost Calculate the minimum Labor Cost for each segment. Assume a base Calculate the minimum Material Cost per segment using the minimum labor cost of $11.20 ($11.20 is a rough estimate of labor cost used material cost equation: solely to illustrate the Margin Potential Concept). Minimum Material Cost = [(Lowest Acceptable MTBF * 0.30) / 1000] + Trailing Edge Position Cost Minimum Labor Cost = [$11.20 - (1.12 * Automation Ratings Below)] + 1.12 Customer Segment Information Trailing Edge Material Cost Leading Edge Material Cost Lowest Acceptable MTBF Maximum Automation Level (out of 10) Low Tech $1.50 $8.50 14,000 $35.00 10.0 High Tech $4.00 $10.00 17,000 $45.00 6.0 Margin Potential Maximum Price Minimum Material Cost Minimum Labor Cost Contribution Margin ($) Contribution Margin (%) Product Name Low Tech Able High Tech Able ack -- Foundation Production Analysis Fast Track F121174_049 Round: 0 December 31, 2020 Production vs Capacity F121174_049 Andrews Baldwin Chester Digby Erie Ferris 0 100 200 300 400 500 600 700 800 900 1,000 1,100 1,200 Capacity O Production Andrews 1.287 Baldwin 1,287 Chester 1,287 Digby 1.287 Erie 1,287 Units Produced Ferris 1,287 Production Information Unit Primary Units Inven Name Segment Sold tory 2nd Shift Auto & mation Capacity Revision Age Pfmn Size Material Labor Contr. Over Next Next Plant Date Dec.31 MTBF Coord Coord Price Cost Cost Marg. time Round Round Utiliz. Able Low 1.200 87 11/21/2017 3.1 21000 6.4 13.6 $34.00 $16.17 S10.11 20% 63% 3.0 800 161% Baker Low 1.200 87 11/21/2017 3.1 21000 6.4 13.6 $34.00 $16.17 $10.11 20% 6396 3.0 800 161% Cake Low 1.200 87 11/21/2017 3.1 21000 6.4 13.6 $34.00 $16.17 $10.11 2096 63% 3.0 800 1619 Daze Low 1.200 87 11/21/2017 3.1 21000 6.4 13.6 $34.00 $16.17 $10.11 20% 63% 3.0 800 101% Eat Low 1.200 87 11/21/2017 3.1 21000 6.4 13.6 $34.00 $16.17 $10.11 2096 6396 3.0 800 161% Fast Low 1.200 87 11/21/2017 3.1 21000 6.4 13.6 $34.00 $16.17 S10.11 20% 6396 3.0 800 181% FOUNDATION FAST TRACK Page 4 Top Fast Track Foundation Low Tech Market Segment Analysis F121174_049 Round: 0 December 31, 2020 Top Fast Track F121174_049 Foundation Low Tech Market Segment Analysis Round: 0 December 31, 2020 Accessibility F121174_049 Low Tech Andrews Low Tech Statistics Total Industry Unit Demand Actual Industry Unit Sales Segment % of Total Industry Next Year's Segment Growth Rate 5.040 5.040 70.0% Baldwin 10.0% Chester Digby Erie Low Tech Customer Buying Criteria Expectations Importance 1. Price $15.00 - 35.00 4196 2 Age Ideal Age = 3.0 29% 3. Reliability MTBF 14000-20000 21% 4 Ideal Position Pfmn 4.8 Size 15.2 99% Ferris 0% 20% 40% 60% 80% 100% Perceptual Map for Low Tech Segment Perceptual map (at end of this year) Actual vs Potential Market Share 2020 F121174_049 Low Tech o 16% 14% 12% 10% 8% 6% 10 4% 8 2% 0% Andrews Baldwin O Actual Potential Performande 0 14 Top Products in Low Tech Segment Units Market Sold to Name Share List Age Revision Date Promo Price MTBF Dec.31 Budget Stock Pfmn Size Out Coord Coord Cust. Aware- ness Seg Cust. Sales Access Budget ibility Dec. Cust. Survey Fast Track High Tech Market Segment Analysis Ruutu. U FastTrack F121174_049 December 31, 2020 Accessibility F121174_049 High Tech High Tech Statistics Total Industry Unit Demand Actual Industry Unit Sales Segment % of Total Industry Next Year's Segment Growth Rate 2.160 2.160 30.0% Andrews Baldwin Chester Digby 20.0% Erie Ferris 1. 2. 3. 4. High Tech Customer Buying Criteria Expectations Importance Ideal Position Pfmn 7.4 Size 12.6 3396 Age Ideal Age = 0.0 29% Price $25.00 - 45.00 25% Reliability MTBF 17000-23000 1396 Perceptual Map for High Tech Segment Perceptual map (at end of this year) 0% 20% 40% 60% 80% 100% Actual vs Potential Market Share 2020 F121174_049 High Tech 16% 14% 12% 12 10% 8% 10 6% 4% 2% 0% Andrews Baldwin Chester Digby Potential 0 2 Actual Performande 3310 12 13 14 15 16 18 19 20 Top Products in High Tech Segment Stock Out Name Able Baker Cake Daze Fat Units Market Sold to Share Seg 17% 360 1796 360 360 1796 360 1706 200 Revision Date 11/21/2017 11/21/2017 11/21/2017 11/21/2017 11/21/2017 Pfmn Size Coord Coord 6.4 13.6 6.4 13.8 6.4 6.4 13.6 13 A Cust. List Age Promo Aware- Price MTBF Dec.31 Budget ness $34.00 21000 3.10 $1,000 55% $34.00 21000 3.10 $1.000 55% $34.00 21000 3.10 $1.000 55% $34.00 21000 3.10 $1.000 55% $24 nn 210nn 310 S1 5596 Cust. Sales Access- Budgetibility $1,000 4196 $1.000 4196 $1.000 4196 $1.000 41% Si no Dec. Cust Survey 16 16 16 16 18 1796 13.6 4 104 Margin Analysis Margin Analysis Being able to calculate a healthy Margin Analysis will help the Research & Development Department understand how to change the cost of material, and the Production Department understand how to change the cost of labor. You will need: The Production Analysis report (page 4) of the Fast Track for Round 0 The Segment Analysis reports (pages 5-6) of the Fast Track for Round 0 Determining Current Margin 2nd Shift Automation Capacity Primary Units Unit Revision Age Pfmn Size Material Labor Contr. & Next Next Plant Name Segment Sold Inventory Date Dec.31 MTBF Coord Coord Price Cost Cost Marg. Overtime Round Round Utiliz. Able Low 1,200 87 11/21/2011 3.1 21000 6.4 13.6 $34.00 $16.17 $10.11 20% 63% 3.0 800 161% * The product details are for example only. Your product names and data may differ, but the process to calculate margins is identical. Useful formulas: Contribution Margin($) = Price - (Material Cost + Labor Cost) Margin Percentage (%) = Contribution Margin/Price Calculating Margin Activity In the table, enter each product's price, material cost, and labor cost found in your report, and note whether or not a second shift was used (Y/N). Then, use the values you entered to calculate the Contribution Margin and the Margin Percentage. Incomplete Current Margin Product Name Price Material Cost Labor Cost Second Shift (Y/N) Contribution Margin ($) Contribution Margin (%) | Y 0 Able 34 16.17 10.11 Inc The Round 0 Foundation FastTrack Determining Margin Potential Finding the maximum amount of profit you can get from one unit of a product is called Margin Potential. This is useful for a company when making a decision about whether to go into production or not. In it's simplest form, it is calculated as: Margin Potential = Maximum Price - Minimum Unit Costs Price Use the customer segment table to find the maximum price that customers deem acceptable. You can find this in the Customer Buying Criteria for each segment. Minimum Material Cost Minimum Labor Cost Calculate the minimum Labor Cost for each segment. Assume a base Calculate the minimum Material Cost per segment using the minimum labor cost of $11.20 ($11.20 is a rough estimate of labor cost used material cost equation: solely to illustrate the Margin Potential Concept). Minimum Material Cost = [(Lowest Acceptable MTBF * 0.30) / 1000] + Trailing Edge Position Cost Minimum Labor Cost = [$11.20 - (1.12 * Automation Ratings Below)] + 1.12 Customer Segment Information Trailing Edge Material Cost Leading Edge Material Cost Lowest Acceptable MTBF Maximum Automation Level (out of 10) Low Tech $1.50 $8.50 14,000 $35.00 10.0 High Tech $4.00 $10.00 17,000 $45.00 6.0 Margin Potential Maximum Price Minimum Material Cost Minimum Labor Cost Contribution Margin ($) Contribution Margin (%) Product Name Low Tech Able High Tech Able ack -- Foundation Production Analysis Fast Track F121174_049 Round: 0 December 31, 2020 Production vs Capacity F121174_049 Andrews Baldwin Chester Digby Erie Ferris 0 100 200 300 400 500 600 700 800 900 1,000 1,100 1,200 Capacity O Production Andrews 1.287 Baldwin 1,287 Chester 1,287 Digby 1.287 Erie 1,287 Units Produced Ferris 1,287 Production Information Unit Primary Units Inven Name Segment Sold tory 2nd Shift Auto & mation Capacity Revision Age Pfmn Size Material Labor Contr. Over Next Next Plant Date Dec.31 MTBF Coord Coord Price Cost Cost Marg. time Round Round Utiliz. Able Low 1.200 87 11/21/2017 3.1 21000 6.4 13.6 $34.00 $16.17 S10.11 20% 63% 3.0 800 161% Baker Low 1.200 87 11/21/2017 3.1 21000 6.4 13.6 $34.00 $16.17 $10.11 20% 6396 3.0 800 161% Cake Low 1.200 87 11/21/2017 3.1 21000 6.4 13.6 $34.00 $16.17 $10.11 2096 63% 3.0 800 1619 Daze Low 1.200 87 11/21/2017 3.1 21000 6.4 13.6 $34.00 $16.17 $10.11 20% 63% 3.0 800 101% Eat Low 1.200 87 11/21/2017 3.1 21000 6.4 13.6 $34.00 $16.17 $10.11 2096 6396 3.0 800 161% Fast Low 1.200 87 11/21/2017 3.1 21000 6.4 13.6 $34.00 $16.17 S10.11 20% 6396 3.0 800 181% FOUNDATION FAST TRACK Page 4 Top Fast Track Foundation Low Tech Market Segment Analysis F121174_049 Round: 0 December 31, 2020 Top Fast Track F121174_049 Foundation Low Tech Market Segment Analysis Round: 0 December 31, 2020 Accessibility F121174_049 Low Tech Andrews Low Tech Statistics Total Industry Unit Demand Actual Industry Unit Sales Segment % of Total Industry Next Year's Segment Growth Rate 5.040 5.040 70.0% Baldwin 10.0% Chester Digby Erie Low Tech Customer Buying Criteria Expectations Importance 1. Price $15.00 - 35.00 4196 2 Age Ideal Age = 3.0 29% 3. Reliability MTBF 14000-20000 21% 4 Ideal Position Pfmn 4.8 Size 15.2 99% Ferris 0% 20% 40% 60% 80% 100% Perceptual Map for Low Tech Segment Perceptual map (at end of this year) Actual vs Potential Market Share 2020 F121174_049 Low Tech o 16% 14% 12% 10% 8% 6% 10 4% 8 2% 0% Andrews Baldwin O Actual Potential Performande 0 14 Top Products in Low Tech Segment Units Market Sold to Name Share List Age Revision Date Promo Price MTBF Dec.31 Budget Stock Pfmn Size Out Coord Coord Cust. Aware- ness Seg Cust. Sales Access Budget ibility Dec. Cust. Survey Fast Track High Tech Market Segment Analysis Ruutu. U FastTrack F121174_049 December 31, 2020 Accessibility F121174_049 High Tech High Tech Statistics Total Industry Unit Demand Actual Industry Unit Sales Segment % of Total Industry Next Year's Segment Growth Rate 2.160 2.160 30.0% Andrews Baldwin Chester Digby 20.0% Erie Ferris 1. 2. 3. 4. High Tech Customer Buying Criteria Expectations Importance Ideal Position Pfmn 7.4 Size 12.6 3396 Age Ideal Age = 0.0 29% Price $25.00 - 45.00 25% Reliability MTBF 17000-23000 1396 Perceptual Map for High Tech Segment Perceptual map (at end of this year) 0% 20% 40% 60% 80% 100% Actual vs Potential Market Share 2020 F121174_049 High Tech 16% 14% 12% 12 10% 8% 10 6% 4% 2% 0% Andrews Baldwin Chester Digby Potential 0 2 Actual Performande 3310 12 13 14 15 16 18 19 20 Top Products in High Tech Segment Stock Out Name Able Baker Cake Daze Fat Units Market Sold to Share Seg 17% 360 1796 360 360 1796 360 1706 200 Revision Date 11/21/2017 11/21/2017 11/21/2017 11/21/2017 11/21/2017 Pfmn Size Coord Coord 6.4 13.6 6.4 13.8 6.4 6.4 13.6 13 A Cust. List Age Promo Aware- Price MTBF Dec.31 Budget ness $34.00 21000 3.10 $1,000 55% $34.00 21000 3.10 $1.000 55% $34.00 21000 3.10 $1.000 55% $34.00 21000 3.10 $1.000 55% $24 nn 210nn 310 S1 5596 Cust. Sales Access- Budgetibility $1,000 4196 $1.000 4196 $1.000 4196 $1.000 41% Si no Dec. Cust Survey 16 16 16 16 18 1796 13.6 4 104


