

Question: Good X (250x, SOV (150K, 150Y) (100x, 100Y) Income-$2000, P-$10, P-$10 (50X, 250Y) Income $3000, P-$10, P-$10 The shift from the green to the
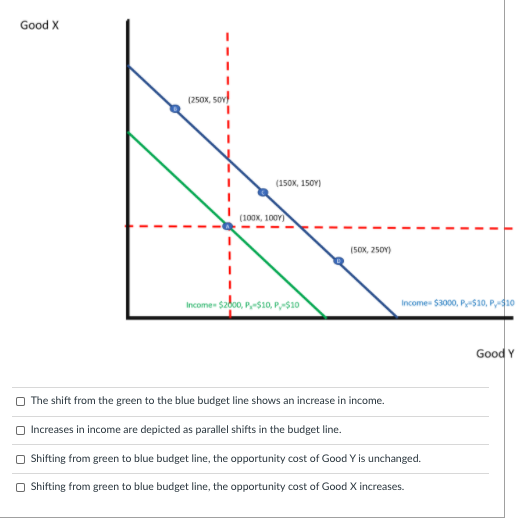
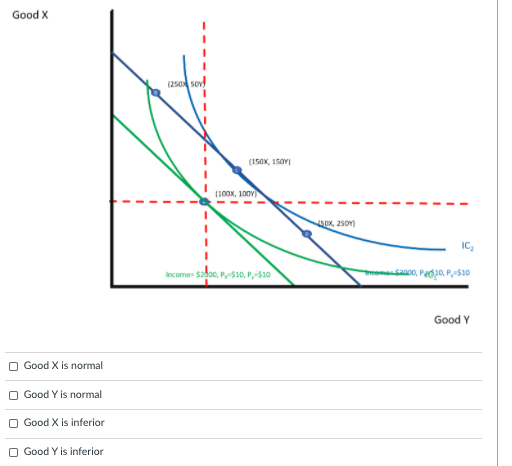
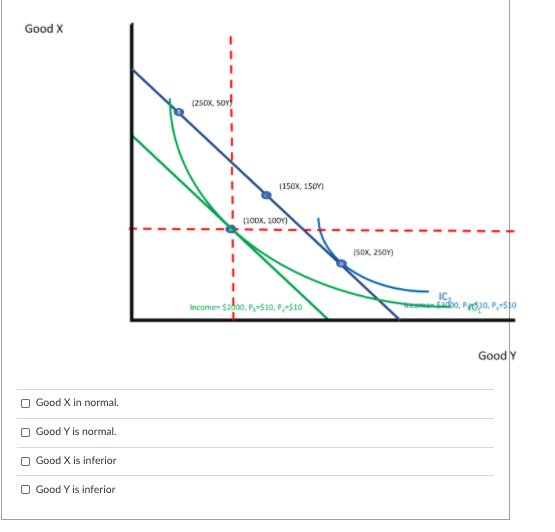
Good X (250x, SOV (150K, 150Y) (100x, 100Y) Income-$2000, P-$10, P-$10 (50X, 250Y) Income $3000, P-$10, P-$10 The shift from the green to the blue budget line shows an increase in income. Increases in income are depicted as parallel shifts in the budget line. Shifting from green to blue budget line, the opportunity cost of Good Y is unchanged. Shifting from green to blue budget line, the opportunity cost of Good X increases. Good Y Good X Good X is normal Good Y is normal Good X is inferior Good Y is inferior (250 So (150x150) (100x, 100V) Income $2000, P-510, P-510 150X, 250Y) IC $2000, P10, P,-$10 Good Y Good X Good X in normal. Good Y is normal. Good X is inferior Good Y is inferior J (250x, 50 (150K, 150Y) (100x, 100) Income $2000, P-$10, P-$10 (50X, 250Y) Treeman doo, Py$10, P-510 Good Y
Step by Step Solution
3.49 Rating (159 Votes )
There are 3 Steps involved in it
The detailed answer for the above question is provided below Question 1 The shift from the green lin... View full answer

Get step-by-step solutions from verified subject matter experts